Average IRA balance by age: what IRS and Fed data show
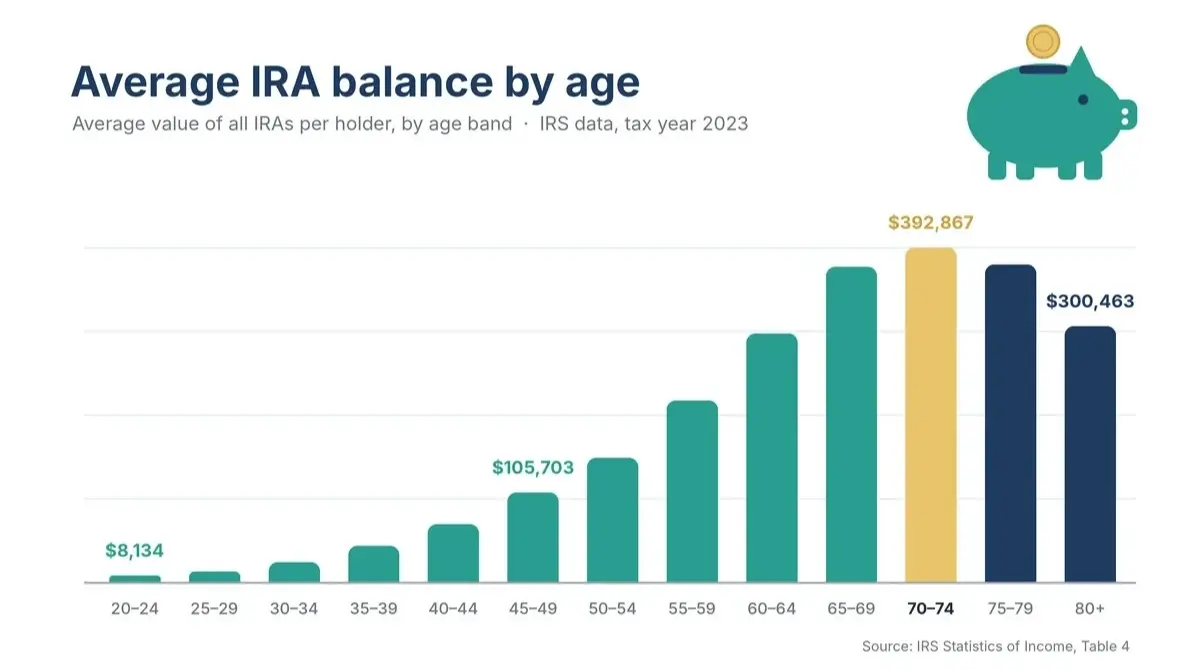
71.1 million taxpayers held an IRA at the end of 2023. IRS data puts the average IRA balance by age highest at 70 to 74, at $392,867 per holder.
In This Article
Rates and limits checked on October 26, 2026.
People in their early 60s who had an IRA held an average of $292,135 across all their IRAs at year-end 2023, and people in their early 30s held $23,801, according to IRS tax-return data. The average rises in every five-year age band until the early 70s, then drops in the later bands, where nearly every holder is taking withdrawals.
$144,523 is Fidelity’s average across 20.3 million IRAs
$144,523 was the average IRA balance at Fidelity on June 30, 2026, up 10% from a year earlier (Fidelity Q2 2026 retirement analysis). Most headlines use this figure because it comes out every quarter.
That average covers one brokerage’s customers and counts only active accounts with a balance. Fidelity’s data page gives no breakdown by age, so it can’t show where someone your age stands. The IRS figures below can.
IRA balances by age band in IRS tax data
The IRS Statistics of Income division builds its IRA tables by matching Form 5498, the statement each IRA custodian files, to individual tax returns. That means the count isn’t limited to one firm’s customers. The latest tables cover tax year 2023.
| Age | People with an IRA | Average, all their IRAs | Average traditional IRA | Average Roth IRA |
|---|---|---|---|---|
| 20 to 24 | 1,847,960 | $8,134 | $9,315 | $7,242 |
| 25 to 29 | 3,763,910 | $13,041 | $9,992 | $12,586 |
| 30 to 34 | 4,880,676 | $23,801 | $19,079 | $20,964 |
| 35 to 39 | 5,086,336 | $43,029 | $38,689 | $29,871 |
| 40 to 44 | 5,347,962 | $68,530 | $65,410 | $40,594 |
| 45 to 49 | 5,424,030 | $105,703 | $106,831 | $46,131 |
| 50 to 54 | 6,060,124 | $146,255 | $149,406 | $54,572 |
| 55 to 59 | 6,682,826 | $213,507 | $214,117 | $65,379 |
| 60 to 64 | 7,845,650 | $292,135 | $289,052 | $72,027 |
| 65 to 69 | 7,921,025 | $370,237 | $357,902 | $90,028 |
| 70 and over | 15,925,617 | $358,143 | $334,461 | $134,039 |
| All ages | 71,058,598 | $205,238 | $225,413 | $57,450 |
Year-end fair market value, tax year 2023. “All their IRAs” is the IRS Table 4 total value divided by the number of holders in each band. The traditional and Roth averages are the IRS’s own Table 8 figures for people holding that type. Source: IRS SOI individual retirement arrangement tables.
Roth averages beat traditional averages only at ages 25 to 34. From 45 on, the average traditional IRA is more than twice the average Roth. Traditional IRAs held 83% of the $14.58 trillion in all IRAs in 2023. The tax rules behind that split are covered in how Roth and traditional IRAs are taxed.
The highest band in the IRS’s finer age table is 70 to 74, at $392,867 per holder. The average falls to $372,901 at 75 to 79 and $300,463 at 80 and over. In the 75-to-79 band, 4.39 million of the 4.58 million holders took a withdrawal in 2023.
These are 2023 dollars, and your statement shows 2026 dollars. The inflation calculator converts one to the other for a closer comparison.
Why is the average so far above the median?
Take five IRAs holding $20,000, $30,000, $40,000, $50,000 and $1 million. Their average is $228,000. The median, the middle account, is $40,000, and four of the five accounts sit below the average.

The IRS publishes averages only, so its table can’t tell you what the middle IRA holder in your age band has. The Federal Reserve’s Survey of Consumer Finances reports both measures for retirement accounts, which it defines as IRAs plus workplace accounts such as 401(k)s and 403(b)s.
In 2025, 54.9% of families held one. The median was $106,000 and the mean was $451,100, so the mean is more than four times the median (Federal Reserve, Changes in U.S. Family Finances from 2022 to 2025).
Three data sources, three different averages
Each number answers a different question, which is why they disagree.

| Source | Who is counted | Accounts included | Latest data | How often |
|---|---|---|---|---|
| IRS Statistics of Income | Every taxpayer with an IRA on Form 5498 or 1099-R | Traditional, Roth, SEP and SIMPLE IRAs | Tax year 2023 | Yearly |
| Fidelity | Fidelity IRA customers with an active balance | IRAs held at Fidelity | June 30, 2026 | Quarterly |
| Fed Survey of Consumer Finances | A sample of families with a retirement account | IRAs and 401(k)-type plans combined, per family | 2025 survey | Every three years |
Sources: IRS SOI Tables 1, 4 and 8; Fidelity Q2 2026 retirement analysis; Federal Reserve SCF 2025 report.
Counting the family instead of the person makes a large difference. Among families aged 55 to 64 with an IRA or a 401(k)-type plan, the mean combined balance was $670,200 in 2025 (Box 2, Table A of the Fed report). That is more than double the IRS’s IRA-only averages for people of the same ages.
Rollovers also shape IRA averages. In 2023, 5.86 million taxpayers rolled $682.4 billion into IRAs, more than seven times the $89.1 billion contributed that year (IRS Table 1).
If most of your savings sit in a workplace plan, the average 401(k) balance by age is the fairer comparison. Moving a 401(k) into an IRA explains how a rollover changes which account holds the money.
Projecting a $60,000 IRA from age 45 to 65
Example: a single 45-year-old has $60,000 across their IRAs, below the IRS average of $105,703 for holders aged 45 to 49. They add $7,500 a year through age 49 and $8,600 a year from 50 through 64. Those are the 2026 limits with the age-50 catch-up, held flat. The projection assumes a 5% annual return with each deposit made at year end. That rate is an assumption, not a forecast.
At 5%, the account reaches $430,929 at 65. The starting $60,000 grows to $159,198, and the $166,500 of deposits grows to $271,731. Changing the return moves the result by tens of thousands of dollars:
| Assumed annual return | Balance at 65 |
|---|---|
| 4% | $376,829 |
| 5% | $430,929 |
| 6% | $493,924 |
Calculated from the inputs above. Nominal dollars, with contribution limits held at 2026 levels.
The $430,929 is in future dollars, while the IRS table is in 2023 dollars, so the two don’t line up exactly. To rerun the projection with your own figures, open the retirement calculator. Enter your age, current IRA balance, yearly contribution and an assumed return.
The compound interest calculator shows the growth on your starting balance alone, with no new deposits.
A fee-only fiduciary adviser can work through what this projection leaves out. One question to bring: “At my current contribution rate, what monthly income could this IRA support from age 67, and how much more per year would close the gap to my target?”
Two common questions about IRA balances
How many Americans have an IRA?
71.1 million taxpayers had at least one IRA at the end of 2023. That is about one in three of the 215.1 million taxpayers on that year’s returns (IRS Table 4). The share rises with age, reaching 45% of taxpayers aged 60 to 64.
What is the average IRA balance at 70?
For holders aged 70 to 74, the IRS average across all their IRAs was $392,867 for tax year 2023, the highest of any age band. Required withdrawals from traditional IRAs begin at 73 for people reaching that age in 2023 or later. The required minimum distribution rules explain how each year’s amount is figured.
Check your 2026 contribution room before April 15, 2027
April 15, 2027 is the last day for most people to make IRA contributions that count for 2026. The deadline is your return’s due date for the year, not counting extensions (IRS Publication 590-A).
For 2026, your combined traditional and Roth contributions can’t exceed $7,500, or $8,600 at age 50 or older. If your taxable compensation for the year is lower, it is the cap instead (IRS IRA contribution limits). The spousal and catch-up details are in this year’s IRA contribution limits.
Roth contributions also phase out at higher incomes, and the ranges for each account type are in IRA types and income limits. The Roth IRA calculator shows what a year of maximum deposits could grow to at your age and an assumed return.
Deadline: Filing an extension for your 2026 return does not move the IRA contribution deadline. For most filers it stays at April 15, 2027.
Informational disclaimer
The content on Finance Authority Hub is provided for general informational and educational purposes only and should not be considered personalized financial, investment, tax, legal, or professional advice. Financial decisions depend on your individual goals, income, risk tolerance, location, and regulatory situation. Before acting on any information, strategy, estimate, or calculator result, consult a qualified licensed professional who can evaluate your specific circumstances.