What Your Average 401(k) Balance by Age Really Means
The average 401(k) balance by age looks alarming — until you see the median. At $44,115, the typical account holds far less than headlines suggest.
In This Article
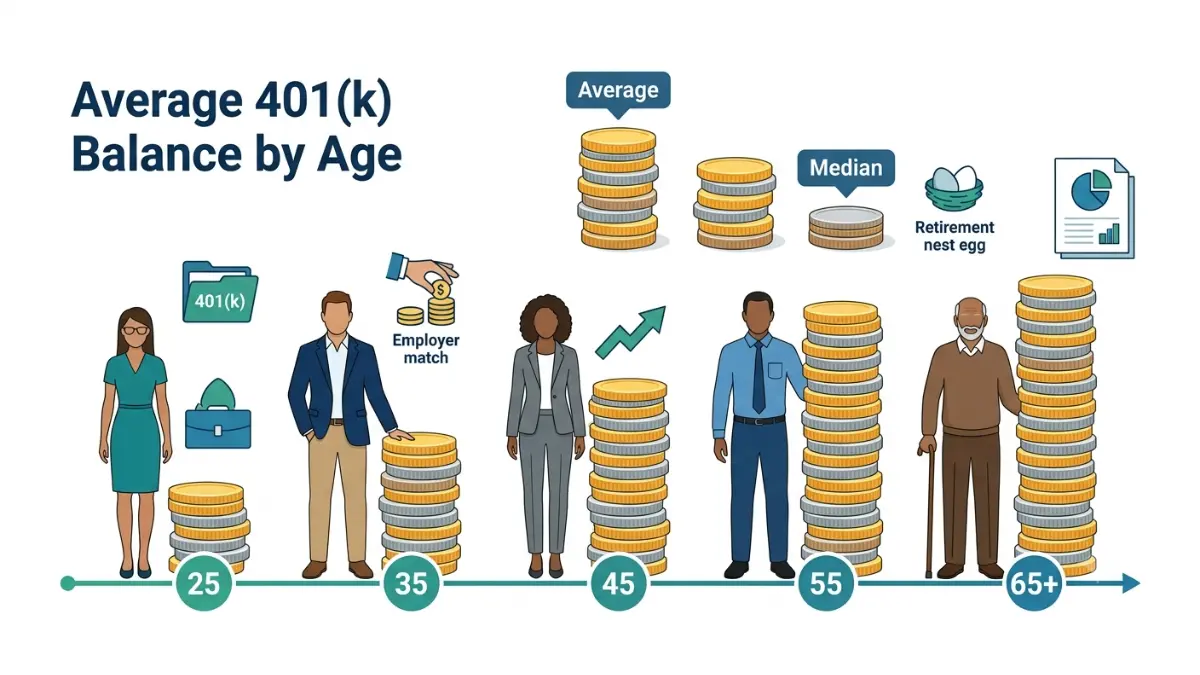
The average 401(k) balance across Vanguard‘s retirement plans was $167,970 at the end of 2025. The median — the account sitting right in the middle — was $44,115. That gap between the two numbers is the whole story of this page.
If you just checked your balance and felt behind, you were probably comparing yourself against the average, and the average is misleading. Where you actually stand depends on your age, so this guide breaks the data down by age band and gives you the median for yours.
Read it based on where you are. In your 20s or 30s, focus on the early-age rows and why starting small still works. At 45 or older and worried about catching up, the reality-versus-benchmark section and the contribution limits matter most. As a higher earner, the income breakdown will land closest to home.
ℹ️ Financial Disclaimer: This article is for general educational purposes only and is not personalized investment, tax, or retirement advice. Retirement account rules, contribution limits, and tax treatment carry real financial consequences; before acting on anything here, consult a fiduciary financial advisor or a CPA about your specific situation.
Average and median 401(k) balance by age
Here is the 401(k) balance by age, showing both the average and the median for each group, from Vanguard’s year-end 2025 data.
| Age | Average balance | Median balance |
|---|---|---|
| Under 25 | $7,259 | $2,234 |
| 25–34 | $50,261 | $18,732 |
| 35–44 | $120,742 | $46,919 |
| 45–54 | $214,991 | $78,730 |
| 55–64 | $305,006 | $107,269 |
| 65 and older | $330,186 | $103,202 |
| All participants | $167,970 | $44,115 |
Source: Vanguard, How America Saves 2026. Data as of December 31, 2025. Figures reflect 401(k) balances only.
How your age band compares
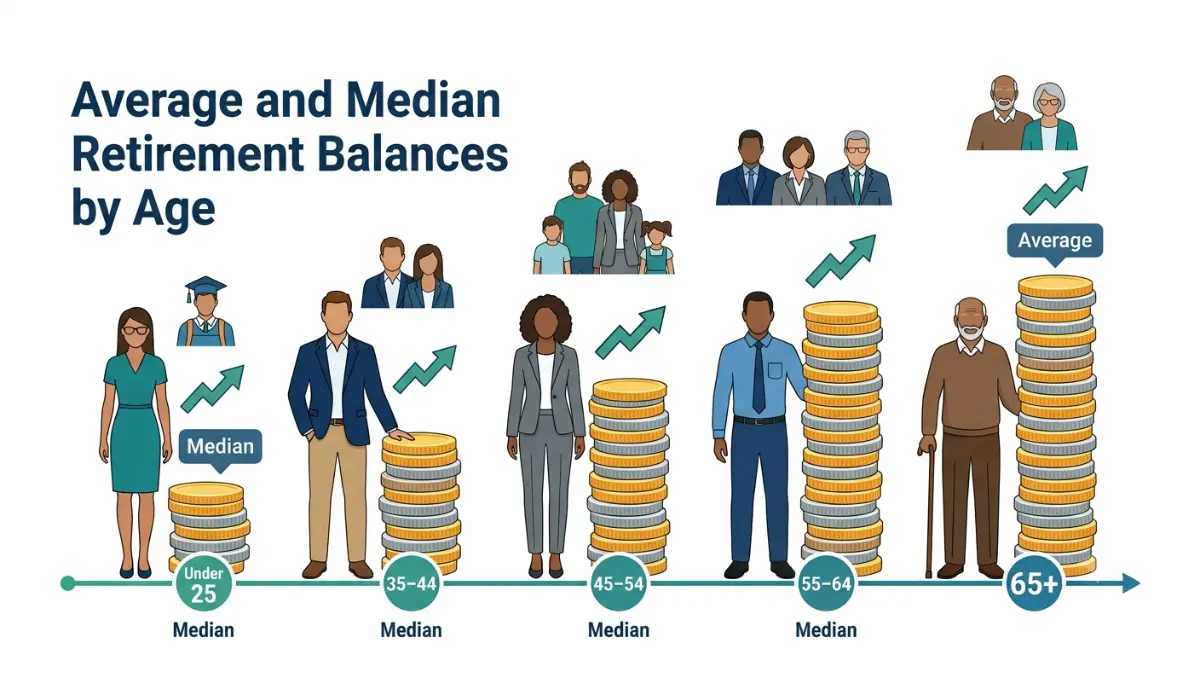
Balances climb steadily with age, which makes sense: more years of contributions, more time for compounding, and usually higher income. The median balance rises from $2,234 for workers under 25 to $107,269 for the 55–64 group.
Notice the slight dip at 65 and older. Once people retire, contributions stop and withdrawals begin, so the median edges down even as the oldest, largest accounts keep the average high.
What a good balance looks like at 40, 50, and 60
For a saver in their early 40s, the 35–44 median is $46,919. In their early 50s, the 45–54 median is $78,730. Approaching 60, the 55–64 median is $107,269.
Treat these as reference points, not report cards. A “good” balance is one that’s on track for your retirement plan — which the later sections help you gauge.
Why the average 401(k) balance is misleading
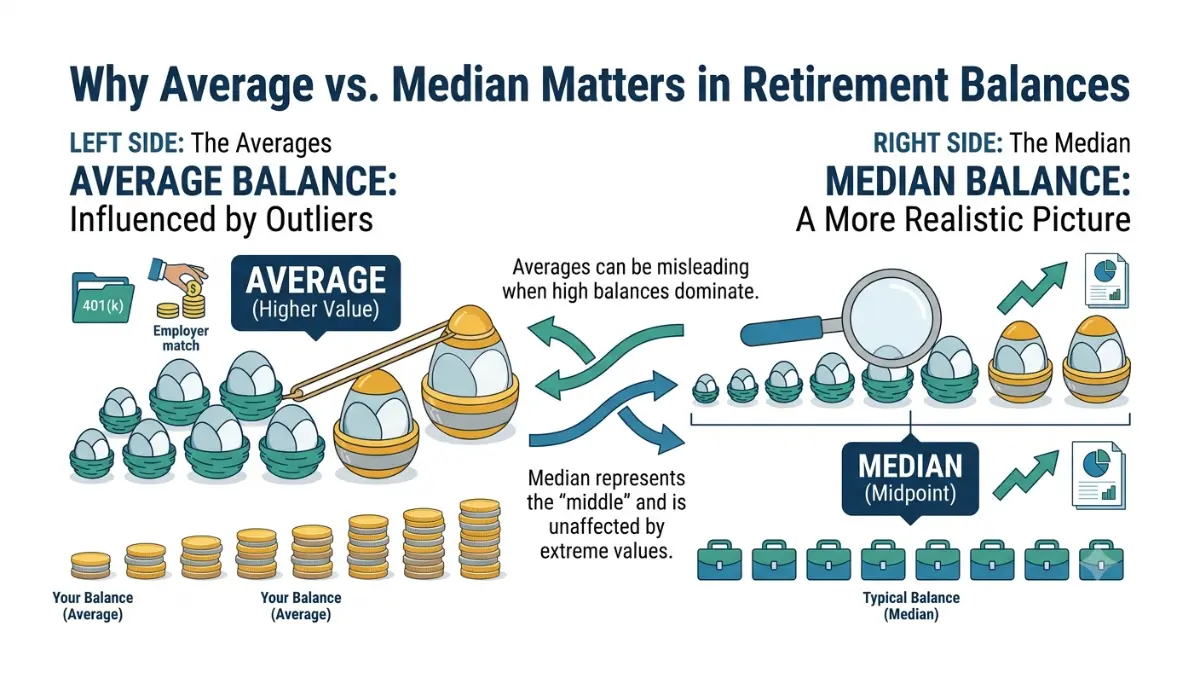
The average 401(k) balance sits far above the median because a small number of very large accounts pull the mean upward. Vanguard’s $167,970 average lands at roughly the 75th percentile — meaning about three in four participants have less.
🔍 How It Works: The average adds up every account and divides by the number of accounts, so a handful of seven-figure balances drags it up. The median instead finds the middle account — half of savers are above it, half below — which is why it better reflects a typical balance.
Average vs. median, explained
Vanguard’s own analysis notes that averages lean toward participants who are older, longer-tenured, or higher-income. The distribution shows it plainly: roughly 1 in 4 participants held less than $10,000, while 18% held $250,000 or more.
The same mean-versus-median gap runs through household wealth generally, as the Federal Reserve’s Survey of Consumer Finances documents. And not everyone even has a plan — retirement benefit access ranged from 59% of private-industry workers at the smallest firms to 90% at the largest as of March 2025, according to the Bureau of Labor Statistics. Participant-based benchmarks don’t capture workers with no access at all.
Why Vanguard and Fidelity report different numbers
You’ll see different figures depending on the recordkeeper. Fidelity’s Q4 2025 analysis put the average 401(k) balance at $146,400 and the median at $34,400 — both below Vanguard’s.
Neither is more accurate. Vanguard administers more large-employer plans skewed toward higher earners, while Fidelity’s broader mix of plan sizes pulls both numbers down. They’re snapshots of different slices of the same workforce.
How much you should have saved — reality vs. the rule of thumb
The most cited savings benchmark comes from Fidelity: aim for 1x your salary saved by 30, 3x by 40, 6x by 50, 8x by 60, and 10x by 67.
- By age 30: 1x your salary
- By age 40: 3x your salary
- By age 50: 6x your salary
- By age 60: 8x your salary
- By age 67: 10x your salary
Here’s the catch those tables rarely mention: Fidelity’s targets count all your retirement savings and assume you save about 15% of income every year from age 25. The Vanguard medians above are 401(k) balances only. The two aren’t measuring the same thing.
The income effect
Income is the single strongest predictor of your balance, and the spread is wide.
| Annual income | Average balance | Median balance | Key detail |
|---|---|---|---|
| $30,000–$49,999 | $29,172 | $11,659 | Cash flow limits saving |
| $50,000–$74,999 | $65,239 | $29,033 | Near the participant midpoint |
| $75,000–$99,999 | $114,670 | $56,115 | Match capture becomes routine |
| $100,000–$149,999 | $198,912 | $103,396 | Compounding accelerates |
| $150,000 and above | $401,412 | $230,536 | Statutory limits within reach |
Source: Vanguard, How America Saves 2026 (year-end 2025).
Below $30,000, the median 401(k) balance falls under $7,000 — a reflection of tighter cash flow and lower plan access, not weaker discipline.
Worked example: reconciling the median with the target
Take a 45-year-old earning $80,000. Fidelity’s rule of thumb suggests 3x–4x salary saved — roughly $240,000 to $320,000. The real 45–54 median is $78,730.
That gap looks alarming until you read it correctly. The Fidelity figure is an aspirational, all-accounts target that assumes a lifelong 15% savings rate; the median is where actual 401(k) balances sit. If your balance falls between the median and the average for your age, you’re already ahead of most of your peers.
✅ Action Step: Before deciding you’re behind, add up every retirement account you hold — current 401(k), old 401(k)s, and IRAs — and compare that total against the Fidelity multiple for your age. A compound interest calculator shows what raising your contribution by even one or two percentage points does over 20 years, and our guide on how much to contribute to your 401(k) turns the gap into a number.
What changed in 2025 — and how much you can contribute now
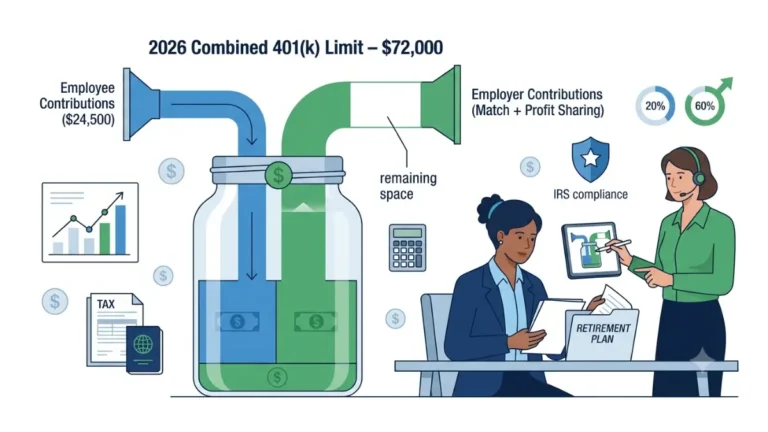
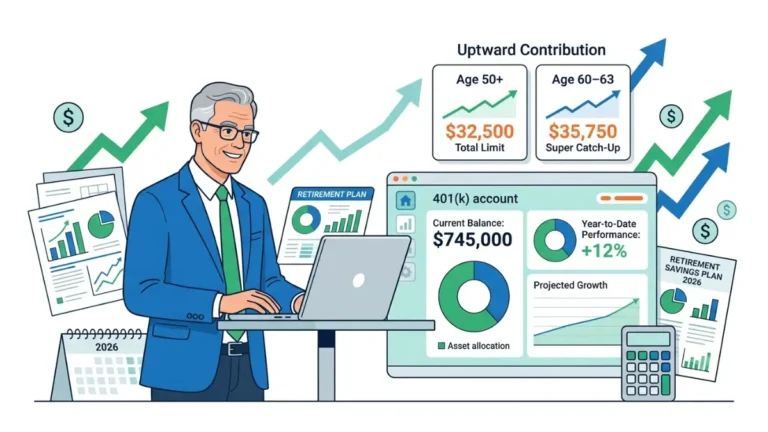
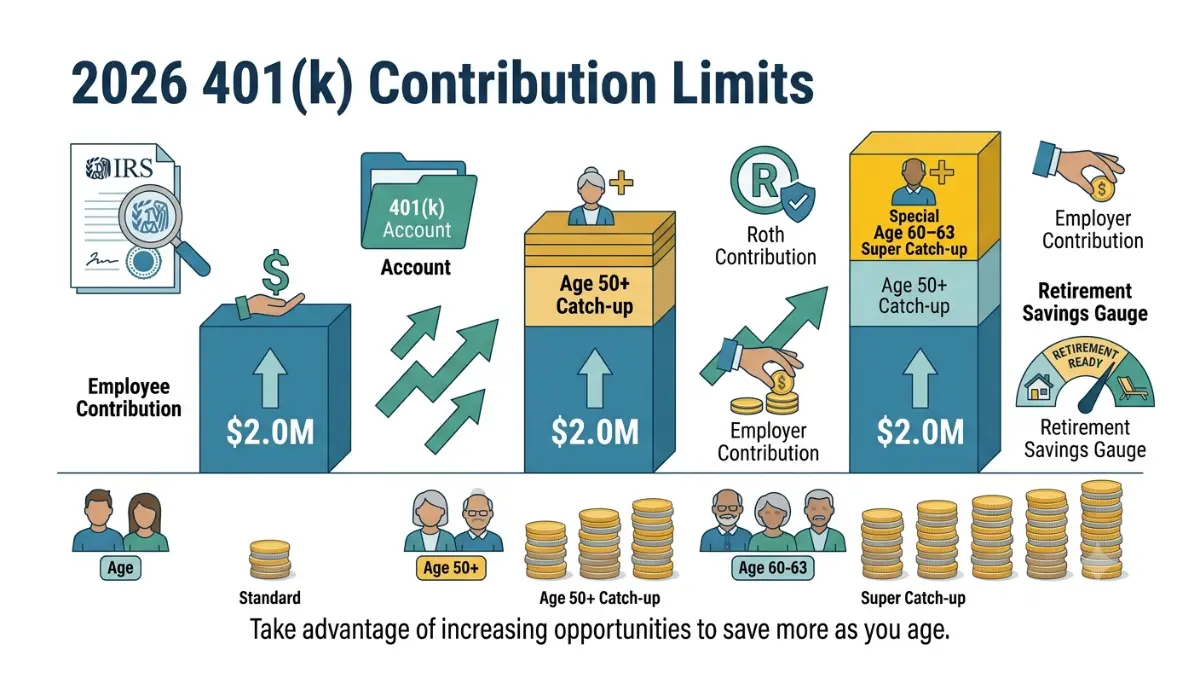
You can contribute up to $24,500 to a 401(k) in 2026 — the standard elective deferral limit set by the IRS. If you’re 50 or older, you can add an $8,000 catch-up, for $32,500 total.
There’s a larger tier for one narrow window: workers who are 60, 61, 62, or 63 during 2026 can add $11,250 instead, for $35,750. Combined employee-and-employer contributions can reach $72,000. You can review the IRS’s 2026 contribution limits directly, or our full breakdown in the pillar guide to 2026 contribution limits, match, and payouts.
Why balances hit records in 2025
The record balances were mostly a market story, not a savings surge. Stocks and bonds both had a strong year, and the average one-year participant return across Vanguard plans was 19.3%.
📊 Data Point: The average one-year participant total return across Vanguard 401(k) plans was 19.3% in 2025 — Source: Vanguard, How America Saves 2026.
Contribution behavior held flat. The average employee deferral was 7.6% of pay, and only 14% of participants hit the maximum. A balance on any single day mostly reflects where the market was that day.
2026 contribution limits and catch-up rules
One rule is new for 2026. If your prior-year wages from your employer topped $150,000, your catch-up contributions must now go into a Roth account rather than pre-tax — the details are in our explainer on the Roth catch-up rule for high earners.
For everyone 50 and up, catch-up contributions are the fastest lever to lift a below-median balance, when the cash flow is there.
⚠️ Costly Mistake: Assuming a strong market year means you’re on track. A 19% gain reflects the market, not your saving — and if you cut contributions because your balance looks healthy, you give up the one input you actually control.
What your balance means for retirement readiness
A 401(k) balance is a starting point, not a grade. It only becomes meaningful when you measure it against what you plan to spend.
Turning a balance into income: a rough frame
As a rough illustration, one common rule of thumb withdraws about 4% of a balance in the first year of retirement. Applied to the 55–64 median of $107,269, that’s roughly $4,300 a year — a reminder that a 401(k) alone rarely funds a full retirement.
That’s not a verdict on anyone. It’s a prompt to see the whole picture, including Social Security, pensions, and other savings. You can model your own figures with a 401(k) calculator and a broader retirement calculator.
The variables only you can fill in
Your retirement age, expected spending, Social Security timing, other assets, and the order in which you draw down accounts all change the answer. No single benchmark captures them.
✅ Action Step: Ask a fiduciary (fee-only) financial advisor one focused question: “Given my age, savings rate, other assets, and target retirement age, am I on track, and what one change would matter most?” For age-specific tactics, see our guide to retirement savings strategies by age.
Encouragingly, most savers don’t cash out when they leave a job — 97% of assets available for distribution in 2025 stayed invested. Sustained over years, that habit matters more than any single year’s balance.
Common 401(k) mistakes that keep balances below the median
A below-median balance often traces to a few avoidable errors, not a lack of discipline.
Leaving the employer match on the table
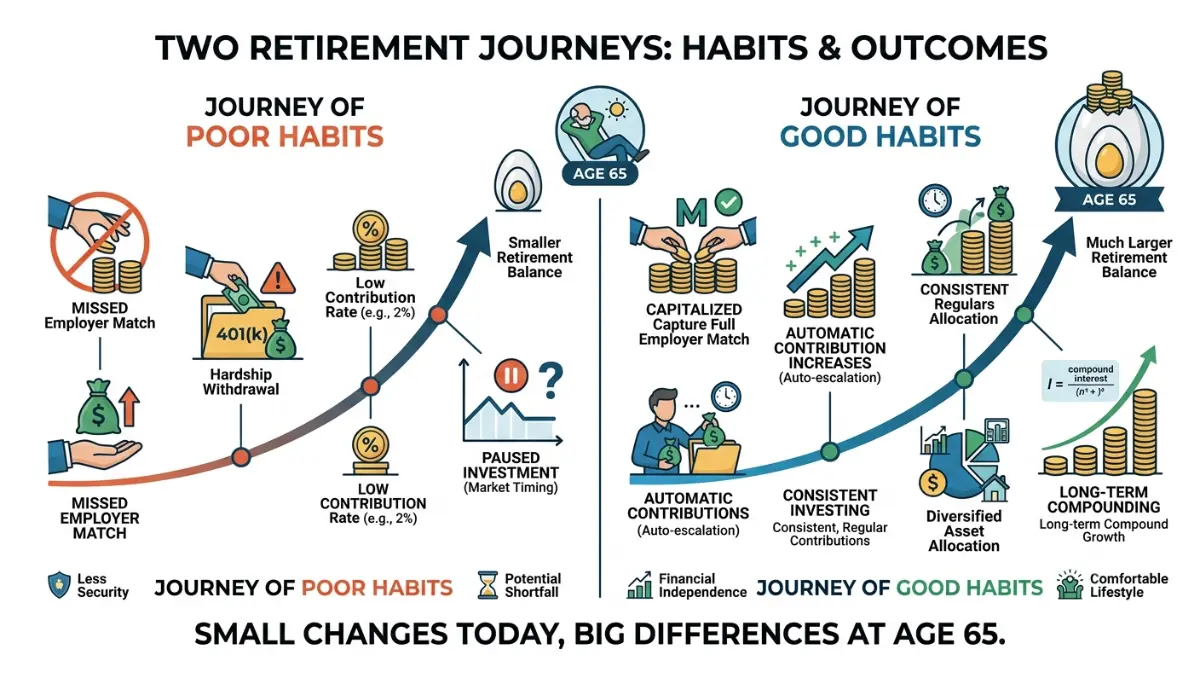
The most expensive mistake is not contributing enough to capture the full employer match. That’s an immediate return on your money, and skipping it is exactly why we treat the match as free money you shouldn’t leave behind.
A second, quieter drag is staying at a low automatic-enrollment default rate for years without ever raising it.
Treating your 401(k) as an emergency fund
Hardship withdrawals are rising. About 6% of Vanguard participants took one in 2025 — up from roughly 5% the year before, and part of four straight years of increases.
The typical withdrawal was small, which suggests these are emergency stopgaps rather than large raids. Still, money pulled out early stops compounding, and a 401(k) doing double duty as an emergency fund is a signal to build a separate cash cushion.
💡 Expert Note: A common point of confusion is treating a 401(k) loan or hardship withdrawal as “borrowing from yourself” at no cost. The real cost is the growth those dollars would have earned while invested — which, over a decade or two, usually dwarfs the amount withdrawn.
Frequently asked questions
1. What is the average 401(k) balance by age?
Vanguard’s year-end 2025 data shows the average 401(k) balance by age rising from $7,259 for workers under 25 to $330,186 for those 65 and older. Medians are far lower at every age — $2,234 under 25 up to $103,202 at 65-plus. Across all participants, the average is $167,970 and the median $44,115. The median better reflects a typical saver.
2. What is a good 401(k) balance at 40?
For the 35–44 group, Vanguard reports a median 401(k) balance of $46,919 and an average of $120,742. Treat these as reference points, not targets. Whether you’re on track depends on your income, other savings, and retirement age, so it’s worth reviewing your full picture with a fiduciary advisor.
3. How much should I have in my 401(k) at 50?
Vanguard’s year-end 2025 figures put the 45–54 median 401(k) balance at $78,730 and the average at $214,991. Fidelity’s rule of thumb suggests 6x salary by 50, but that target counts all retirement accounts, not just your 401(k). Because adequacy depends on your whole financial picture, a CPA or fiduciary advisor can tell you what your number really means.
4. What is the average 401(k) balance at 60?
For workers ages 55–64, Vanguard reports an average 401(k) balance of $305,006 and a median of $107,269. The average is inflated by a small number of very large accounts, so the median is the more realistic comparison near 60. Whether it’s enough depends on your spending, Social Security timing, and other assets — worth confirming with an advisor.
5. Why is the average 401(k) balance higher than the median?
Because a small number of very large accounts pull the average up. Vanguard’s average of $167,970 sits near the 75th percentile, meaning roughly three in four participants have less. The median of $44,115 marks the exact middle of all balances, which is why it’s the more representative figure for a typical 401(k) saver.
6. Is $167,970 a good 401(k) balance?
That figure is the all-participant average, and it sits near the 75th percentile — so about three in four Vanguard participants hold less. It isn’t a target most savers should measure against. Compare your balance to the median for your age band instead, then judge adequacy against your own retirement plan and, ideally, an advisor’s input.
7. How much can I contribute to my 401(k) in 2026?
The IRS 2026 limit is $24,500 in employee contributions. If you’re 50 or older, you can add an $8,000 catch-up for $32,500; if you’re 60 to 63, the catch-up rises to $11,250 for $35,750. Combined employee and employer contributions can reach $72,000. High earners must now make catch-up contributions on a Roth basis.
8. How does income affect my 401(k) balance?
Income is the strongest predictor. Vanguard’s year-end 2025 data shows a median 401(k) balance of $11,659 for those earning $30,000–$49,999, rising to $230,536 for those earning $150,000 or more. Higher earners have more to save, more generous matches, and longer tenure — all of which compound. Below $30,000, medians fall under $7,000.
9. How did 401(k) balances change in 2025?
They hit records, driven mostly by markets rather than saving. The average one-year participant return across Vanguard plans was 19.3%, while the average employee deferral held flat at 7.6% of pay. A strong market year lifts every balance, but that gain reflects the market on a given date, not what an account will be worth long term.
10. How much should I be saving for retirement each year?
Vanguard suggests a total of 12%–15% of income, combining your contributions and your employer’s match; Fidelity’s guideline is 15% including the match. In 2025, only 14% of Vanguard participants hit the contribution maximum. Your own target depends on when you plan to retire and your other income, so consider confirming it with a fiduciary advisor.
11. Does the average 401(k) balance include employer match or other accounts?
The Vanguard figures reflect 401(k) balances only. Employer contributions that landed in your 401(k) are included, but IRAs, pensions, home equity, and Social Security are not. That’s why a 401(k)-only median looks lower than all-accounts benchmarks like Fidelity’s salary multiples, which count every retirement account you hold.
The bottom line on your 401(k) balance
Compare yourself to the median for your age, not the headline average. The average is skewed by the wealthiest accounts, and measuring against it makes most savers feel further behind than they really are.
Then treat your balance as a starting point. Add up all your retirement accounts, weigh them against a realistic target, and run your own numbers. If you’re deciding where new dollars should go, our guide on whether to max a 401(k) or an IRA first and an investment growth calculator are good next stops.

Informational disclaimer
The content on Finance Authority Hub is provided for general informational and educational purposes only and should not be considered personalized financial, investment, tax, legal, or professional advice. Financial decisions depend on your individual goals, income, risk tolerance, location, and regulatory situation. Before acting on any information, strategy, estimate, or calculator result, consult a qualified licensed professional who can evaluate your specific circumstances.