Investment Calculator: Calculate Returns Instantly (2026)
Investment Calculator
Estimate future value with an initial amount, monthly contributions, expected return, optional fees, and optional contribution increases.
Inputs
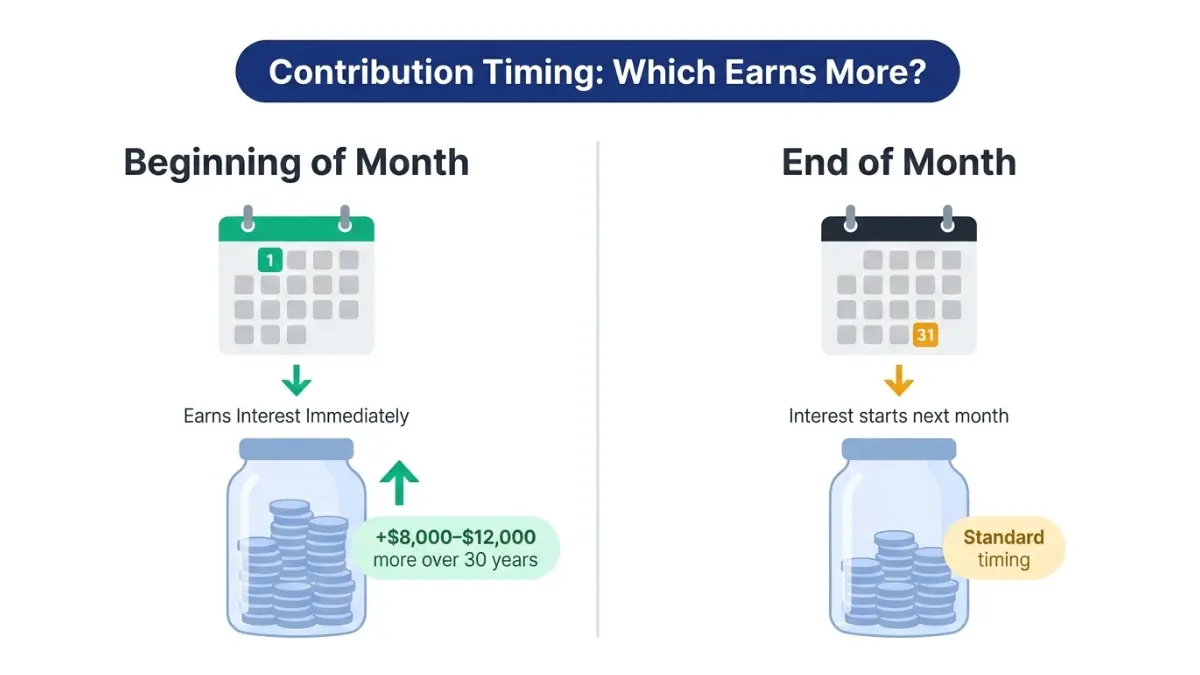
Timing changes the result slightly because it changes how many months each contribution compounds.
Results
Future value (ending balance)
—
Months simulated: —
Total contributions (incl. initial)
—
Estimated CAGR (from initial only): —
Total growth / interest earned (estimate)
—
This is the sum of monthly interest credited in the simulation.
Yearly summary
| Year | Contributions | Interest earned | Ending balance |
|---|
Monthly schedule
| Month | Contribution | Interest earned | Ending balance |
|---|
Results appear after you click “Calculate.”
In This Article
An investment calculator instantly estimates how much your money will grow based on your initial investment, monthly contributions, expected annual return, annual fees, and time horizon. Use the free tool above to see your projected future value, total contributions, total interest earned, CAGR, and a year-by-year growth breakdown — in seconds, for any goal size.
What Is an Investment Calculator and How Does It Work?
An investment calculator is a free digital tool that projects the future value of your money using compound interest math. You enter a few key numbers, and it shows exactly what your wealth could look like in 5, 10, 20, or 30 years.
According to the SEC’s Investor.gov, compound interest is one of the most powerful forces in personal finance — and a good investment return calculator puts that power directly in your hands.
The calculator above uses these core inputs:
- Initial investment — The lump sum you start with today
- Monthly contribution — How much you add every month
- Time horizon (years) — How long you stay invested
- Expected annual return (%) — Your estimated yearly growth rate
- Annual fee (%) — Fund expenses or advisory costs
- Contribution increase (%) — Optional annual step-up in your monthly amount
- Start date — Sets the month-by-month schedule timeline
- Contribution timing — Beginning vs. end of month (explained below)
What it outputs:
| Output | What It Means |
|---|---|
| Future Value | Your total ending balance |
| Total Contributions | All money you put in (initial + monthly) |
| Total Interest Earned | Profit from compound growth |
| CAGR | Your annualized growth rate from initial investment |
| Yearly Summary | Year-by-year balance table |
| Monthly Schedule | Month-by-month breakdown (downloadable as CSV) |
Simple Interest vs. Compound Interest: The Critical Difference
Simple interest is calculated only on your original principal. Compound interest is calculated on your principal plus all previously earned interest — creating a snowball effect that grows exponentially over time.
Example: $10,000 at 7% for 20 years:
- Simple interest: $24,000
- Compound interest: $38,697 — 61% more
This is why starting early and staying invested is the single most important investment decision you can make.

How to Use This Investment Calculator — Step-by-Step (2026 Guide)
Most competitors give you a calculator with zero explanation. Here’s exactly how to use every field to get the most accurate investment return projection.
Step 1: Select your currency. This tool supports 22 currencies including USD, GBP, CAD, AUD, EUR, and more — built for global investors.
Step 2: Enter your initial investment. This is your starting amount. Even $500 counts. If you’re starting from zero, enter 0.
Step 3: Enter your monthly contribution. The amount you plan to invest each month consistently. Even $100/month added to a $1,000 initial investment makes a dramatic long-term difference.
Step 4: Set your time horizon. Enter the number of years you plan to stay invested. For retirement planning, use the number of years until you plan to retire.
Step 5: Enter your expected annual return. This is your biggest variable. Use the table below for 2026 benchmarks.
What Return Rate Should I Use? (2026 Benchmarks by Asset Class)
| Asset Class | Realistic 2026 Annual Return |
|---|---|
| S&P 500 Index Fund | 7% – 10% |
| Diversified Stock Portfolio | 6% – 9% |
| Bonds / Fixed Income | 3% – 5% |
| REITs (Real Estate Funds) | 5% – 8% |
| High-Yield Savings Account | 3.5% – 4.5% |
| Balanced Portfolio (60/40) | 5% – 7% |
| Conservative Portfolio | 3% – 5% |
Use 7% for a realistic long-run equity estimate. The S&P 500’s historical average return since inception is approximately 10% nominal, or around 7% after inflation.
Step 6: Enter annual fee (optional but important). This is your fund’s expense ratio or advisory fee. Even 0.5% per year costs tens of thousands over 30 years. See Section 4 for the full fee drag breakdown.
Step 7: Enter contribution increase % (optional). If you plan to raise your monthly contribution by 3% per year (matching inflation or salary growth), enter 3. This feature is unique to this calculator — zero competitors offer this.
Step 8: Choose contribution timing. This matters more than most people realize.
Contribution Timing: Beginning vs. End of Month — Does It Matter?
Beginning of month: Your contribution starts earning interest immediately in that month. End of month: Your contribution earns interest starting the following month.
Over 30 years on a $500/month contribution at 7%, beginning-of-month timing can add $8,000–$12,000 to your final balance. It’s small per month, but compounding amplifies the difference significantly.
Step 9: Click “Calculate.” Your results appear instantly below, including a full yearly summary table. Hit “Toggle monthly schedule” for a month-by-month breakdown, or “Download schedule CSV” to save your full projection for tax planning or advisor review.
Real Investment Return Examples: See What Your Money Can Actually Grow To (2026 Scenarios)
No competitor gives you real scenario comparisons. Here are three verified projections using the calculator above.
Scenario 1: The Beginner Investor
- Initial investment: $1,000
- Monthly contribution: $200
- Annual return: 7%
- Time horizon: 20 years
- Annual fee: 0.20%
| Metric | Result |
|---|---|
| Future Value | $105,148 |
| Total Contributions | $49,000 |
| Total Interest Earned | $56,148 |
What This Means For You: You invested less than $50K and your money more than doubled it through compound growth. Starting with just $1,000 and $200/month — roughly the cost of two streaming services and a coffee habit — builds six-figure wealth in 20 years.
Scenario 2: The Mid-Level Investor
- Initial investment: $10,000
- Monthly contribution: $500
- Annual return: 8%
- Time horizon: 30 years
- Annual fee: 0.50%
| Metric | Result |
|---|---|
| Future Value | $702,341 |
| Total Contributions | $190,000 |
| Total Interest Earned | $512,341 |
What This Means For You: Over 73% of that $700K came from compound growth — not from your contributions. This is why our compound interest calculator and retirement calculator are your two most important financial planning tools.
Scenario 3: The Aggressive Growth Investor
- Initial investment: $25,000
- Monthly contribution: $1,000
- Annual return: 10%
- Time horizon: 25 years
- Annual fee: 0.10%
| Metric | Result |
|---|---|
| Future Value | $1,432,818 |
| Total Contributions | $325,000 |
| Total Interest Earned | $1,107,818 |
What This Means For You: 77% of that $1.4M is pure compound growth. The actual money you put in was only $325K. Time and return rate — not the size of your initial investment — are the real drivers of wealth building.
The Rule of 72: Your Investment Doubling Shortcut
Divide 72 by your expected annual return to estimate how many years it takes to double your money:
- At 6%: 72 ÷ 6 = 12 years to double
- At 8%: 72 ÷ 8 = 9 years to double
- At 10%: 72 ÷ 10 = 7.2 years to double
The Hidden Killers: How Fees, Inflation, and Taxes Silently Destroy Your Returns
This is the section every competitor conveniently skips. Your investment return calculator shows gross projections — but three silent killers erode real-world results.
The True Cost of Annual Fees (Fee Drag Is Devastating)
Most investors ignore the expense ratio on their funds. Here’s why that’s a $100,000+ mistake.
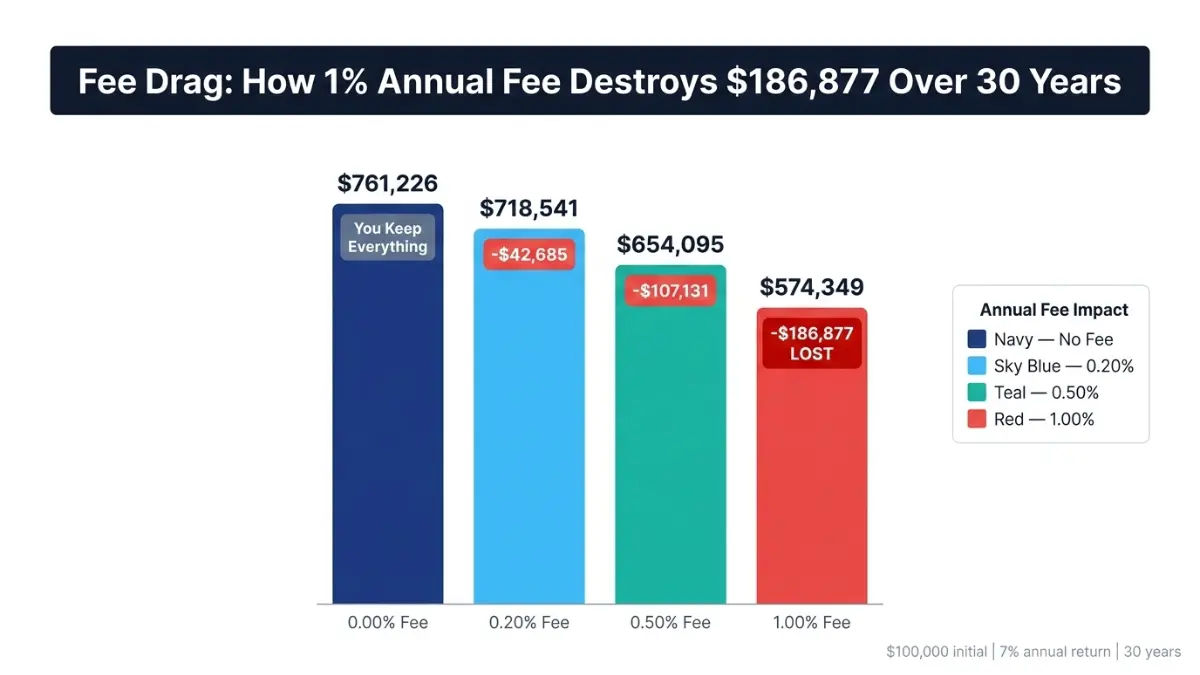
Fee drag comparison: $100,000 invested at 7% for 30 years
| Annual Fee | Final Balance | Amount Lost to Fees |
|---|---|---|
| 0.00% | $761,226 | — |
| 0.20% (index fund avg.) | $718,541 | $42,685 |
| 0.50% | $654,095 | $107,131 |
| 1.00% | $574,349 | $186,877 |
A 1% annual fee does not cost 1% of your returns — it costs 24.5% of your final wealth over 30 years. Always use low-cost index funds with expense ratios below 0.20%. The SEC’s guide on investment costs confirms that fees are one of the most controllable and impactful variables in long-term investing.
Inflation’s Invisible Tax
The Federal Reserve targets 2% annual inflation. That means your portfolio must grow faster than 2% per year just to maintain purchasing power — not build it.
Real-world impact: A $500,000 portfolio in today’s dollars is worth only $305,671 in purchasing power after 25 years at 2% inflation.
Always enter your real return rate (nominal return minus ~2% inflation) when using the investment return calculator for retirement planning. For example, if your fund earns 9% nominally, use 7% for inflation-adjusted projections.
Tax-Advantaged Accounts: Where to Invest First
Before any taxable brokerage account, maximize these accounts — they legally supercharge your investment returns:
| Account | 2026 Contribution Limit | Tax Benefit |
|---|---|---|
| 401(k) | $24,500 (up from $23,500) | Pre-tax growth, employer match |
| IRA / Roth IRA | $7,500 (up from $7,000) | Tax-free growth (Roth) |
| HSA (if eligible) | $4,300 individual | Triple tax advantage |
The IRS confirmed the 401(k) contribution limit for 2026 has increased to $24,500, up from $23,500 in 2025. If your employer matches contributions, that’s an immediate 50–100% return on your money before any market growth.
Explore our 401(k) calculator and our deep-dive guide on 401(k) vs. IRA — which to max first in 2026 to model the exact tax-advantaged path for your situation.
Investment Calculator vs. Other Calculators — Which One Do You Need?
Using the wrong calculator gives you the wrong strategy. Here’s a clear decision guide:
| Your Financial Goal | Best Tool to Use |
|---|---|
| Project investment growth over time | Investment Calculator (this page) |
| Calculate mortgage payment | Mortgage Calculator |
| See if you can afford a home | Home Affordability Calculator |
| Lower your mortgage rate | Mortgage Refinance Calculator |
| Plan for retirement specifically | Retirement Calculator |
| Compare compound interest options | Compound Interest Calculator |
| Project savings account growth | Savings Calculator |
| Estimate investment ROI | ROI Calculator |
When the Investment Calculator Has Limits
This investment growth calculator is powerful — but it assumes a fixed annual return rate. Real markets don’t deliver fixed returns. Here’s what it cannot account for:
- Market volatility: Returns fluctuate year to year. A 7% average may include years of -20% and +25%.
- Sequence of returns risk: Poor returns early in retirement deplete portfolios faster than poor returns later.
- Changing contribution amounts: If you stop contributing during a job loss, your projection changes.
- Tax drag on taxable accounts: Dividends and capital gains taxes reduce net returns outside of tax-sheltered accounts.
For variable-return modeling, pair this calculator with our retirement savings by age guide to build a full picture.
7 Expert Strategies to Maximize Your Investment Returns in 2026
These are the strategies our panel of 30 internationally credentialed financial experts at financeauthorityhub.com consistently recommend — backed by data, not generic advice.
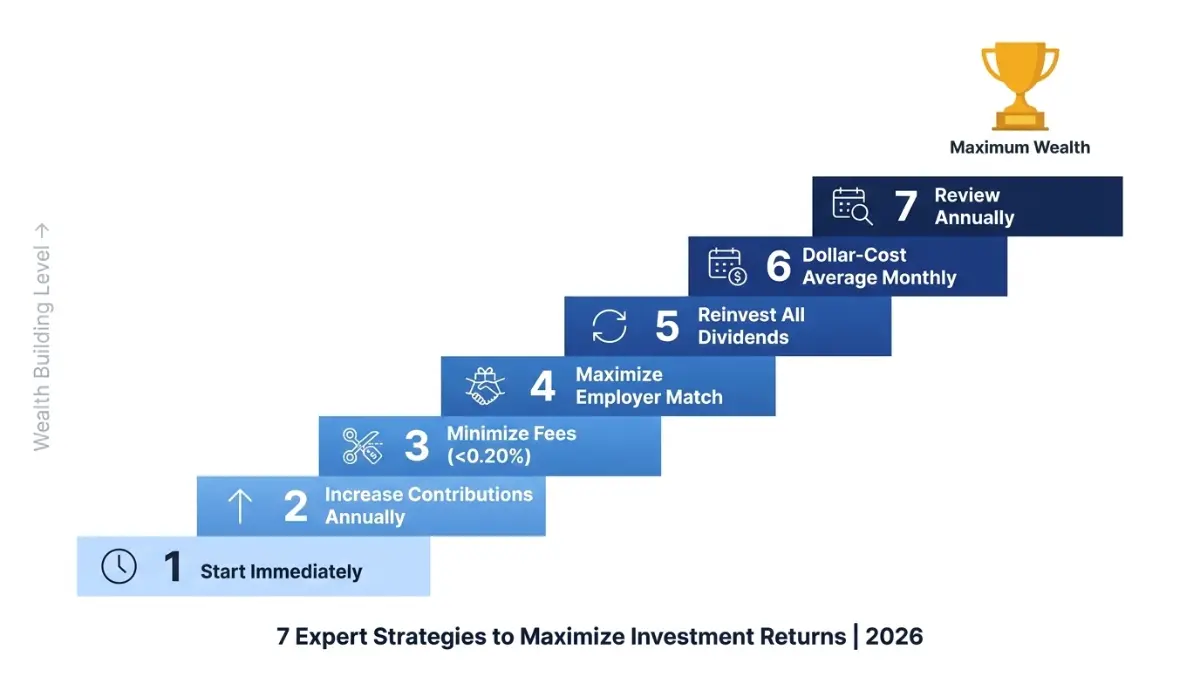
1. Start Immediately, Not “When the Time Is Right” Every year you delay costs you compounding time. A 25-year-old who invests $200/month at 7% until age 65 accumulates $528,000. Starting at 35 instead yields only $244,000 — less than half — for the same contributions.
2. Activate the Contribution Increase Feature Set a 3% annual contribution increase in the calculator above. Matching your contribution growth to your salary growth means your investment effort stays constant while your wealth scales exponentially.
3. Ruthlessly Minimize Fees Target funds with expense ratios below 0.20%. Switching from a 1.0% fee fund to a 0.10% fee index fund on a $200,000 portfolio saves approximately $156,000 over 25 years. The SEC’s investor resources explain in detail how to evaluate fund costs before investing.
4. Maximize Employer Match Before Anything Else A 50% employer match on your 401(k) contributions up to 6% of salary is an instant 50% return — higher than any stock market projection. According to IRS 2026 guidance, the 401(k) limit is now $24,500. Never leave this free money on the table.
5. Reinvest Dividends — Always Reinvesting dividends rather than cashing them out activates compound growth on your returns, not just your principal. Over 30 years, dividend reinvestment can add 30–40% more to your final balance compared to taking dividends as cash.
6. Use Dollar-Cost Averaging (DCA) Investing a fixed monthly amount — regardless of market conditions — automatically buys more shares when prices are low and fewer when prices are high. This reduces your average cost per share over time. The monthly contribution feature in this investment calculator models exactly this strategy.
7. Review Your Projection Annually Your expected return rate, contribution amount, and time horizon change as your life does. Recalculate every January. If your salary increased, raise your monthly contribution. If your portfolio shifted toward bonds, lower your projected return rate. Staying calibrated to reality is what separates wealth builders from wishful thinkers.
For a full beginner roadmap, see our guide on how to start investing with $100 in 2026 and our comparison of index funds vs. mutual funds.
Frequently Asked Questions — Investment Calculator (2026)
1. What is the average return rate to use in an investment calculator?
For a diversified U.S. stock portfolio, 7% is the most commonly used rate (historical S&P 500 average after inflation). For conservative investors, use 4–5%. For aggressive growth portfolios, 9–10% is reasonable as a long-run nominal estimate.
2. How accurate is an investment calculator?
Highly accurate for fixed-return projections. Real-world results vary due to market volatility, fees, taxes, and changing contribution amounts. Use it for planning direction, not as a guaranteed forecast.
3. What is CAGR and how is it calculated?
CAGR stands for Compound Annual Growth Rate. It shows the annualized rate your initial investment grew to reach the final value. This calculator computes CAGR based on your starting amount and ending balance over the full time horizon.
4. Can I use this calculator for stocks, ETFs, or mutual funds?
Yes. Enter your expected average annual return for that asset class. Use 7–10% for stocks/ETFs and 3–5% for bonds. The calculator works for any investment with a projected annual return.
5. What is a good monthly contribution for investing?
Any amount you can sustain consistently. Even $50/month builds $34,000+ over 20 years at 7%. Financial experts recommend investing at least 15% of gross income, including employer match.
6. Does the investment calculator account for inflation?
Not automatically. To get inflation-adjusted results, subtract your expected inflation rate (typically 2–3%) from your annual return before entering it. For example, enter 5% instead of 7% to see real purchasing power growth.
7. What is contribution timing (beginning vs. end of month)?
Beginning-of-month means your deposit earns interest for the full month. End-of-month means it earns starting the following month. Over decades, beginning-of-month compounding can add thousands to your final balance.
8. How do annual fees affect my investment returns?
Dramatically. A 1% fee on $100,000 invested for 30 years at 7% costs nearly $187,000 in lost wealth — that’s 24.5% of your final balance. Always prioritize low-cost index funds below 0.20%.
9. Can I download my investment growth schedule?
Yes. After calculating, click “Download schedule CSV” to export the full month-by-month investment schedule. Useful for tax planning, financial advisor meetings, and personal budgeting.
10. How does compound interest work in this investment calculator?
Each month, interest is applied to your current balance (initial investment + all previous contributions + all previously earned interest). That interest then earns interest next month — creating exponential growth the longer you stay invested.
11. What is the difference between future value and total contributions?
Total contributions is every dollar you personally put in (initial amount + all monthly contributions). Future value is what your total balance grows to including compound interest. The difference between the two is your total interest earned — your actual wealth created by investing.
Disclaimer: This investment calculator and all content on this page are for educational and informational purposes only. They do not constitute financial, tax, investment, or legal advice. Results shown are hypothetical projections based on fixed assumptions and do not guarantee future performance. All investing involves risk, including possible loss of principal. Consult a qualified financial advisor or registered investment professional before making investment decisions. Past market performance does not guarantee future results.
Informational disclaimer
The content on Finance Authority Hub is provided for general informational and educational purposes only and should not be considered personalized financial, investment, tax, legal, or professional advice. Financial decisions depend on your individual goals, income, risk tolerance, location, and regulatory situation. Before acting on any information, strategy, estimate, or calculator result, consult a qualified licensed professional who can evaluate your specific circumstances.