ROI Calculator — Know Your Profit in Seconds
ROI Calculator
Calculate total ROI, profit, multiple, annualized return (effective), real return (inflation-adjusted), plus monthly & yearly breakdown with CSV export.
Inputs
This affects the annualized return and schedule when monthly contributions are used.
Results
Total invested
—
Initial: —
Contributions: —
Final value
—
Break-even final value: —
Net profit
—
Total ROI: —
Multiple: —
Annualized return (effective)
—
Monthly rate: —
Real annual return: —
Extra detail
Period: — months (~ —)
Avg annual ROI (simple): — (not compounded)
Estimated time to double (at annualized return): —
What-if (target annual return)
Projected final value at your target rate: —
Annualized return is computed so that a month-by-month growth path matches your Final value (especially important when you add monthly contributions). Estimates only; real-world returns vary.
Yearly breakdown (estimated path)
| Year | Start value | Contributions | Growth | End value | Total invested (end) | Profit (end) | ROI (end) |
|---|
Monthly schedule (detailed)
| Month | Start value | Contribution | Growth (est.) | End value | Total invested to date | Profit to date | ROI to date |
|---|
Results appear after you click “Calculate.”
In This Article
An ROI calculator is a free financial tool that instantly shows you your net profit, return on investment percentage, annualized return, and inflation-adjusted real return — all from a single calculation. Whether you’re evaluating stocks, real estate, a business investment, or a marketing campaign, this tool tells you exactly whether your money worked for you — or against you.
Our ROI Calculator above goes far beyond basic tools. It delivers 7 advanced metrics — including monthly contribution modeling, time-to-double, and CSV export — that competitors simply don’t offer.
What Is an ROI Calculator?
A return on investment calculator measures how efficiently your money generated profit. It compares what you put in against what you got back — expressed as a percentage.
Most people understand profit in dollars. But ROI converts that into a percentage rate — making it possible to compare a $5,000 investment against a $500,000 investment on equal footing.
Why ROI Matters More Than Ever in 2026
With U.S. inflation averaging around 3–4% in recent years, a “profit” on paper can still be a real loss after inflation erodes your purchasing power. This is why inflation-adjusted ROI — also called real return — is now an essential metric, not an optional one.
According to the SEC’s investor education resource at Investor.gov, real return is what you actually earn after accounting for taxes and inflation. Our calculator shows you both — nominal and real — so you always know the full picture.
Key Takeaway: A positive ROI doesn’t always mean a good investment. Always check your real annual return (inflation-adjusted) before celebrating.
The ROI Formula — How to Calculate ROI
The Basic ROI Formula
ROI (%) = [(Final Value − Total Amount Invested) ÷ Total Amount Invested] × 100
This is the universal formula used by investors, CFOs, and financial advisors worldwide. It works for stocks, real estate, business projects, and marketing campaigns.

Step-by-Step: How to Calculate ROI
- Identify your total investment — include your initial amount plus any additional contributions
- Determine your final value — the current or ending value of the investment
- Subtract total invested from final value — this gives you net profit
- Divide net profit by total invested — gives you a decimal ratio
- Multiply by 100 — converts to a percentage
Example: You invest $10,000, add $200/month for 3 years (total contributed: $7,200), and your portfolio grows to $22,500.
- Total invested: $17,200
- Net profit: $5,300
- ROI: 30.8%
Simple ROI vs. Annualized ROI — What’s the Difference?
| Metric | What It Shows | Best Used For |
|---|---|---|
| Simple ROI | Total return over entire period | Quick snapshot comparisons |
| Annualized ROI | Return per year (compounded) | Comparing different-duration investments |
| Real Annual Return | Annualized ROI minus inflation | Measuring actual purchasing power gained |
Why does this matter? A 30% ROI over 10 years is very different from a 30% ROI over 1 year. Annualized ROI — which our calculator computes automatically — levels the playing field.
Fidelity’s ROI guide confirms that the S&P 500 has historically delivered over 10% average annual return since 1957 — making it one of the most reliable benchmarks for evaluating your investment calculator results.
What Is a Good ROI Percentage? (2026 Benchmarks)
This is the most-searched question by users arriving at ROI calculator pages — and the one no competitor actually answers well beside their tool. Here’s the full breakdown.
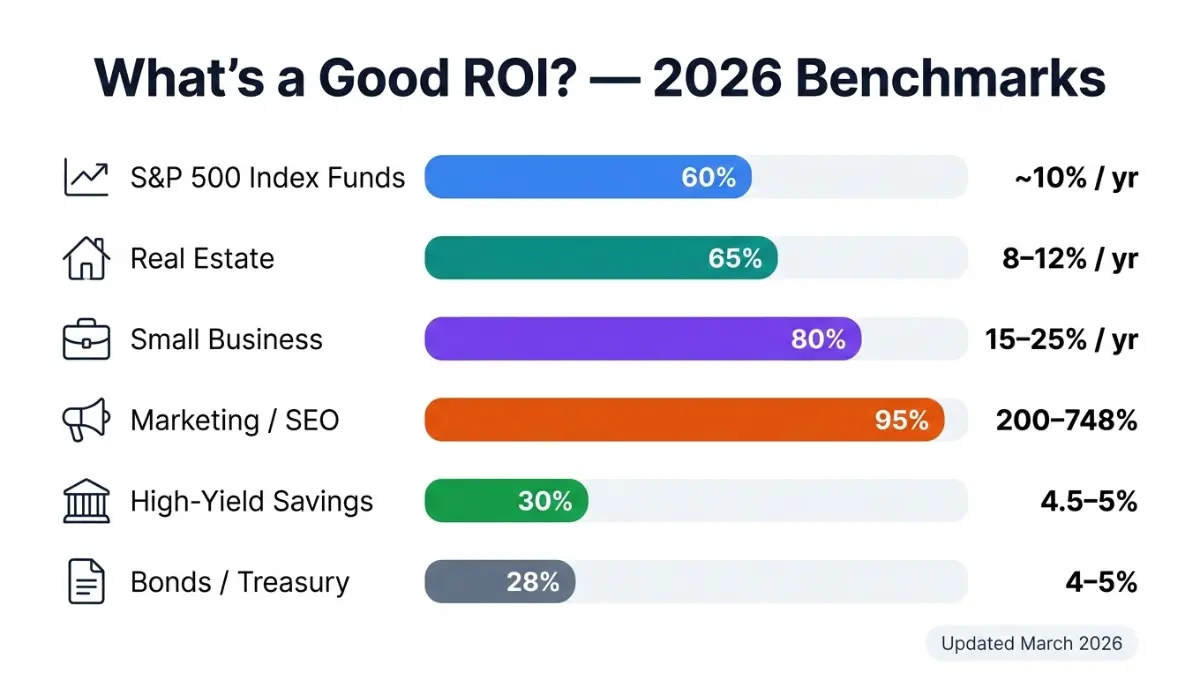
ROI Benchmarks by Investment Type (2026)
| Investment Type | Typical Annual ROI | Risk Level |
|---|---|---|
| S&P 500 Index Funds | ~10% historical avg. | Medium |
| Real Estate (rental) | 8–12% | Medium |
| Small Business | 15–25% | High |
| Marketing (SEO) | 200–748% | Low-Medium |
| High-Yield Savings | 4.5–5.0% | Very Low |
| Bonds (U.S. Treasury) | 4–5% | Very Low |
| Savings Account (standard) | 0.5–1% | Very Low |
What Is Considered a Good ROI?
- Positive ROI = your investment made money ✅
- ROI above 10% = beats the average stock market return ✅✅
- ROI above 20% = excellent for most asset classes ✅✅✅
- Negative ROI = you lost money — time to reassess your strategy ❌
What This Means For You: If your ROI calculator shows a result under 4–5%, your money may be losing real value after inflation. Consider whether moving funds into higher-performing assets — like index funds — makes sense for your goals. Our investment basics guide shows how to start even with just $100.
The Rule of 72 — How Long to Double Your Money?
Divide 72 by your annual ROI percentage to estimate how many years it takes to double your investment.
- At 6% annual return → doubles in ~12 years
- At 10% annual return → doubles in ~7.2 years
- At 12% annual return → doubles in ~6 years
Our ROI Calculator computes this automatically in the “Time to Double” output field — a feature no top competitor offers.
How to Use Our ROI Calculator — Step-by-Step
This calculator was built to deliver results that Wall Street analysts actually use — not just a basic percentage. Here’s how to get the most from it.
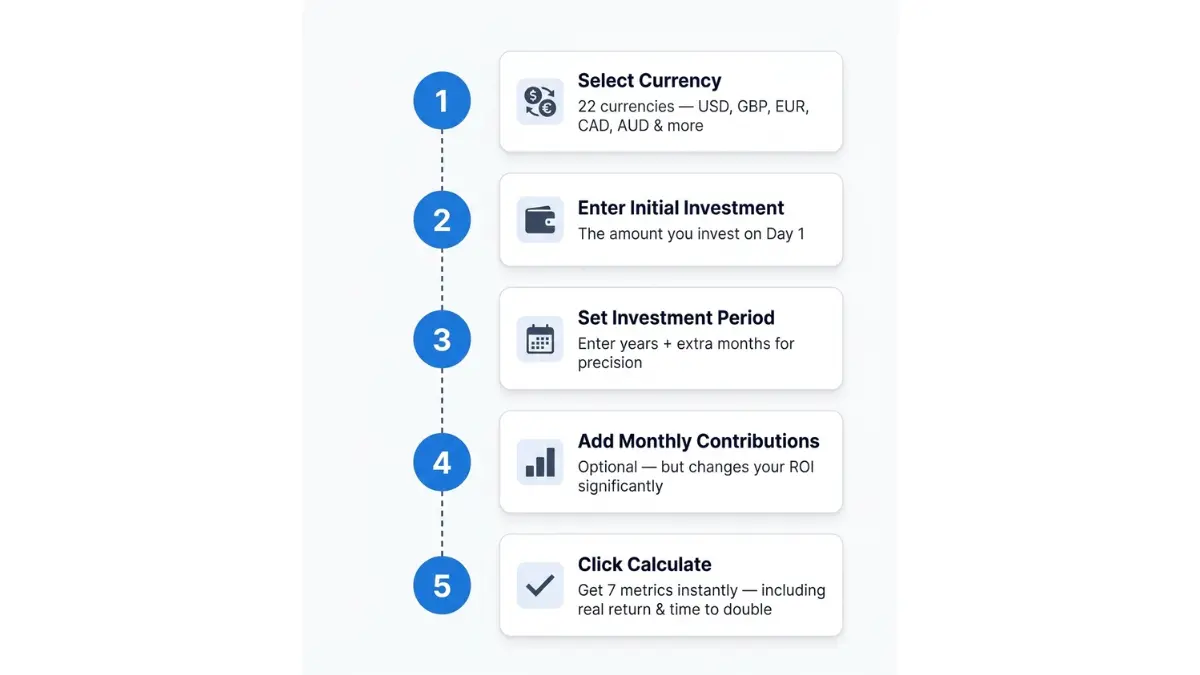
Step 1: Enter Your Core Inputs
- Currency — Select from 22 currencies (USD, GBP, EUR, CAD, AUD, and more)
- Initial Investment — The amount you invested at the start
- Final Value — The current or projected ending value of your investment
- Investment Period — Enter years + any additional months for precision
Step 2: Add Monthly Contributions (Optional but Powerful)
If you invest regularly — like a monthly 401(k) contribution — enter your monthly contribution amount and select timing (start or end of month). This changes your annualized return calculation significantly because compounding starts earlier with beginning-of-month contributions.
Pro Tip: Even a $100/month addition to a $5,000 starting investment dramatically changes your ending balance over 10 years. Run both scenarios to see the difference.
Step 3: Use Advanced Fields for Real-World Precision
| Advanced Field | What It Does |
|---|---|
| Inflation Rate | Converts your nominal return to a real (inflation-adjusted) return |
| Start Date | Adds real calendar month labels to your monthly schedule |
| Target Annual Return % | Runs a “what-if” projection at your desired rate |
Step 4: Understand Your Results
| Output Metric | What It Means |
|---|---|
| Net Profit | Final value minus total amount invested |
| ROI % | Total return as a percentage |
| Annualized Return (Effective) | Compounded yearly growth rate |
| Real Annual Return | Return after subtracting inflation |
| Time to Double | Years to 2× your investment at current rate |
| Monthly Rate | The month-by-month growth rate behind the annual figure |
| What-If Final Value | Projected result at your target annual return |
Step 5: Explore Your Monthly and Yearly Schedule
Click “Toggle Monthly Schedule” to see a full month-by-month breakdown — showing exactly how your contributions, growth, and profit build over time. Click “Download Schedule CSV” to export your full schedule for spreadsheet analysis or tax records.
No competitor in the top 10 offers a live monthly schedule with CSV export inside a free ROI calculator. This is your competitive advantage.
For context on how mortgage-related investments compare, our Mortgage Calculator shows how monthly payments stack against potential investment returns.
ROI Calculator in Action — 5 Real Use Cases (2026)
Use Case 1: Stock Market Investment ROI
Scenario: You invest $15,000 in an S&P 500 ETF and add $300/month for 7 years.
- Total invested: $40,200
- Estimated final value at 10% annualized: ~$68,000
- Net profit: ~$27,800
- ROI: ~69% | Annualized: ~10%
This mirrors the historical performance benchmark verified by Investor.gov’s risk and return education page, which notes stocks have historically outperformed all other asset classes over long periods.
Thinking about index funds vs. other options? Our Index Funds vs. Mutual Funds guide breaks down the key differences.
Use Case 2: Real Estate Investment ROI
Scenario: You put $50,000 down on a rental property. After 5 years, the property is worth $85,000 (based on your equity position) and you’ve received $18,000 in net rental income.
- Total returned: $85,000 + $18,000 = $103,000
- Total invested: $50,000
- ROI: 106% | Annualized: ~15.5%
Real estate investors must also factor in property taxes, maintenance, and vacancy rates — costs that reduce your real ROI. Use the Home Affordability Calculator to model the full cost of entry before calculating ROI.
Use Case 3: Small Business Investment ROI
Scenario: You purchase $20,000 in new equipment. Over 2 years, the equipment enables $35,000 in additional revenue.
- Net profit: $15,000
- ROI: 75% | Annualized: ~36%
For business owners financing through a loan, use our Business Loan Calculator to factor in interest costs — which directly reduce your actual ROI.
Use Case 4: Marketing Campaign ROI
Scenario: You spend $5,000 on a paid ad campaign and generate $22,000 in tracked sales revenue.
- Net profit: $17,000
- ROI: 340%
A 300–500% ROI is widely considered excellent for digital marketing campaigns. Anything above 500% is exceptional. Pair this with our Auto Loan Calculator if you’re financing business vehicles as part of your marketing infrastructure.
Use Case 5: Savings Account vs. Investment Comparison
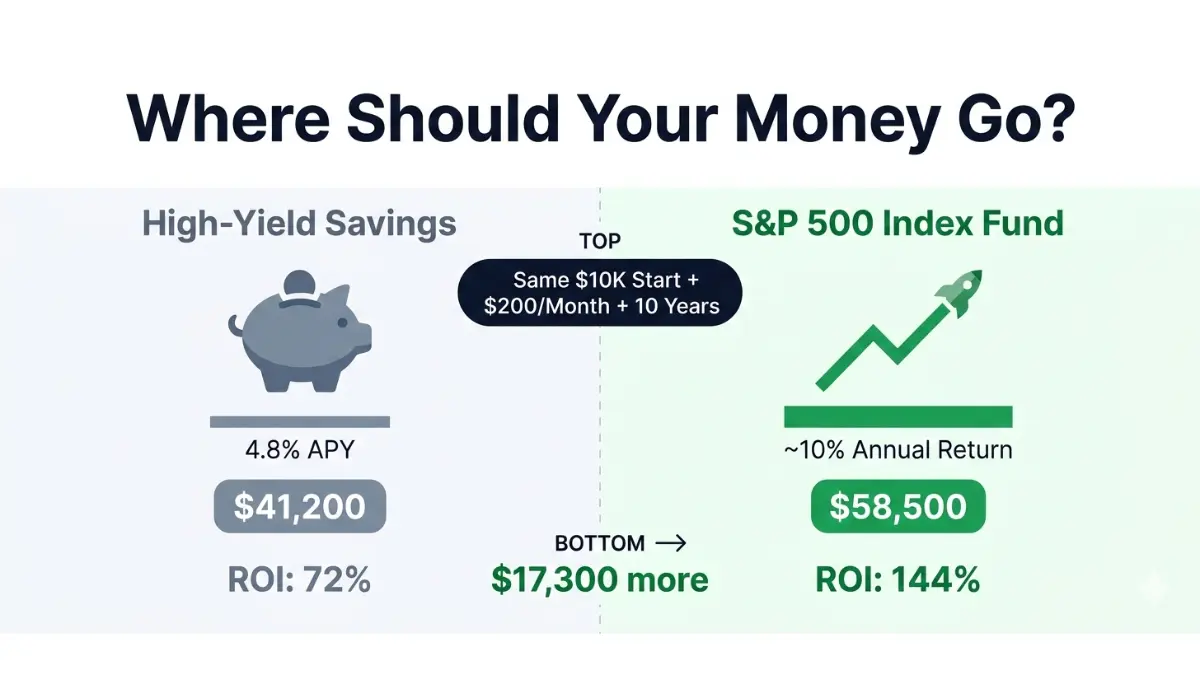
| Option | Starting Amount | Monthly Add | Period | Ending Value | ROI |
|---|---|---|---|---|---|
| High-Yield Savings (4.8% APY) | $10,000 | $200 | 10 years | ~$41,200 | 72% |
| S&P 500 Index Fund (10% avg.) | $10,000 | $200 | 10 years | ~$58,500 | 144% |
The gap is real. Over 10 years, investing in an index fund vs. a savings account nearly doubles your net return — even with the same monthly contributions. Explore our What is Compound Interest guide to understand exactly how this compounding effect works.
Frequently Asked Questions — ROI Calculator
1. What does ROI stand for?
ROI stands for Return on Investment. It measures how much profit or loss you earned on an investment relative to its cost, expressed as a percentage.
2. What is the ROI formula?
ROI (%) = [(Final Value − Total Invested) ÷ Total Invested] × 100. This formula works for any investment type — stocks, real estate, business equipment, or marketing.
3. What is a good ROI percentage in 2026?
For stocks, beating the S&P 500’s historical ~10% annual average is considered strong. For business investments, 15–25% is typical. For marketing, 300%+ is the standard benchmark for a successful campaign.
4. What is the difference between ROI and annualized ROI?
Simple ROI shows your total return over the whole period. Annualized ROI breaks that down to a per-year rate — making it possible to fairly compare a 2-year investment against a 10-year investment.
5. How do I calculate ROI with monthly contributions?
Enter your monthly contribution amount in our calculator. It models each month’s growth separately — so contributions made at the start of the month compound slightly faster than end-of-month contributions.
6. What is inflation-adjusted ROI and why does it matter?
Inflation-adjusted ROI — or real return — subtracts inflation from your nominal annual return. If your investment earns 7% annually but inflation runs at 3.5%, your real return is only 3.5%. This tells you how much your purchasing power actually grew.
7. What does “time to double” mean in the calculator?
It shows how many years it takes for your investment to double at the current annualized return rate — calculated using the Rule of 72 (72 ÷ annual return %). Our calculator shows this automatically.
8. Can ROI be negative?
Yes. A negative ROI means your investment lost money — the final value is less than what you invested. A negative ROI is a clear signal to reassess your strategy. Learn how debt affects your net returns in our Debt 2026 guide.
9. How is ROI different from CAGR?
ROI shows total percentage return without regard to time. CAGR (Compound Annual Growth Rate) shows the smoothed annual growth rate assuming reinvestment each year. Our annualized ROI output is functionally equivalent to CAGR when there are no contributions.
10. What is the difference between ROI and profit margin?
ROI measures return relative to the cost of investment. Profit margin measures profit relative to revenue. Both are important metrics but serve different analytical purposes.
11. How do I use the CSV export from this calculator?
Click “Download Schedule CSV” after calculating. The file downloads automatically and opens in Excel, Google Sheets, or any spreadsheet tool — showing your full month-by-month breakdown of contributions, growth, end value, and ROI-to-date.
Related Tools & Guides
- 📊 Mortgage Calculator — See how mortgage costs compare to investment returns
- 🎓 Student Loan Calculator — Calculate the real cost of student debt vs. investment potential
- 📈 401(k) vs. IRA — Which to Max First? — Maximize your tax-advantaged investment ROI
- 💰 Roth IRA 2026 Complete Guide — How to grow $500K tax-free
- 📉 Capital Gains Tax 2026 — How taxes reduce your real investment ROI
⚠️ Disclaimer: This ROI calculator and all related content on this page are provided for educational and informational purposes only. Results are estimates based on the inputs you provide and mathematical modeling. They do not constitute financial, investment, tax, or legal advice. Past investment performance does not guarantee future results. Investment values can decrease as well as increase. Consult a qualified and licensed financial advisor before making any investment decisions. FinanceAuthorityHub.com is not a registered investment advisor.
Informational disclaimer
The content on Finance Authority Hub is provided for general informational and educational purposes only and should not be considered personalized financial, investment, tax, legal, or professional advice. Financial decisions depend on your individual goals, income, risk tolerance, location, and regulatory situation. Before acting on any information, strategy, estimate, or calculator result, consult a qualified licensed professional who can evaluate your specific circumstances.