Retirement Calculator: Will You Run Out of Money?
Retirement Calculator
Project retirement savings growth before retirement and withdrawals during retirement, with inflation adjustment, yearly tables, and CSV export.
Inputs
Used to estimate “needed at retirement” and a simple income estimate.
Results
Timeline
Years to retirement: —
Years in retirement: —
Savings at retirement
—
Inflation-adjusted: —
Rule-of-thumb estimates
Needed at retirement: —
Monthly income at —: —
Longevity check
Lasts to life expectancy: —
If not, depletion age: —
Totals (estimate)
Total contributions: —
Total withdrawals: —
Ending balance at life expectancy (or depletion): —
Pre-retirement yearly projection
| Age | Start balance | Contributions | End balance |
|---|
Retirement yearly drawdown
| Age | Start balance | Withdrawals | End balance |
|---|
Results appear after you click “Calculate.”
Use our free retirement calculator above to find out in under 2 minutes — before it’s too late.
The median American worker has just $955 saved for retirement through a defined contribution plan, according to a 2026 report by the National Institute on Retirement Security. That number includes millions of workers who have saved nothing at all. If you feel behind, you’re not alone — but you need to act now. Whether your savings will last depends entirely on three things: how much you’ve saved, what you spend in retirement, and how long you live. Enter your numbers into our retirement calculator above and get a year-by-year projection of your exact savings balance, monthly income, and depletion age — all in under 2 minutes.
How Much Should You Have Saved By Now? (2026 Benchmarks)
Most people don’t know if they’re on track because no one ever shows them the target. Here’s the honest benchmark table — your savings vs. what you actually need.

2026 Retirement Savings Benchmarks by Age
| Age | Fidelity Target | U.S. Median Actual | Shortfall |
|---|---|---|---|
| 30 | 1× your salary | $18,880 | Severe |
| 40 | 3× your salary | $45,000 | Major |
| 50 | 6× your salary | $117,000 | Significant |
| 60 | 8× your salary | $185,000 | Critical |
| 67 | 10× your salary | $200,000 | Alarming |
Sources: Federal Reserve Survey of Consumer Finances 2023; Fidelity Retirement Guidelines
These aren’t goals — they’re minimums. And the gap is staggering. Only about 9.3% of U.S. households with retirement accounts have $500,000 or more saved. Meanwhile, Americans say they need $1.26 million to retire comfortably.
Why most people fall short:
- Lifestyle inflation in their 30s and 40s — income rises but so does spending
- Missing the employer 401(k) match — this is free money left on the table
- Starting too late — every decade of delay roughly doubles the required monthly contribution
- Ignoring inflation — most people underestimate how much prices will rise
What this means for you: If you’re 50 with $117,000 saved, you need to more than triple your balance in 15 years. That’s aggressive but achievable — and our retirement calculator above will show you the exact monthly contribution required to close that gap. You can also use our savings calculator to model how different savings rates compound over time.
How to Use This Retirement Calculator — Field-by-Field Guide
Every competitor embeds a tool and leaves you guessing. We don’t. Here’s exactly what to enter in each field so your results are accurate.
Age Inputs
- Current age: Your age today
- Retirement age: The Social Security Administration defines full retirement age (FRA) as 67 for anyone born after 1960 — but you can retire earlier or later
- Life expectancy: The SSA estimates the average 65-year-old man lives to 82, the average woman to 85. Use 90–95 for conservative planning — running out of money at 88 is a real risk
Savings & Contributions
- Current retirement savings: Add all accounts — 401(k), IRA, Roth IRA, brokerage accounts earmarked for retirement
- Monthly contribution: What you’re contributing now; include your employer match
- 2026 contribution limits (per the IRS):
- 401(k): $24,500 (standard) | $32,500 if age 50+ | $35,750 if ages 60–63 (super catch-up)
- IRA: $7,500 (standard) | $8,500 if age 50+
Return Rates
- Pre-retirement return: Use 7% as a baseline — the S&P 500’s long-term historical average after inflation adjustments
- Post-retirement return: Use 4–5% — most retirees shift toward bonds and lower-risk investments
Inflation
- Enter 2.5–3% — the U.S. 30-year CPI average. Do not leave this blank. Skipping inflation is the #1 mistake people make in retirement planning
Desired Monthly Spending + Other Income
- Desired monthly spending: Be honest. Include housing, healthcare, food, and leisure — don’t lowball this
- Other income: Enter your estimated Social Security benefit. The average monthly Social Security benefit in 2026 is approximately $1,927. Use the SSA Retirement Estimator to find your personalized number. Also include any pension or rental income
Withdrawal Rate
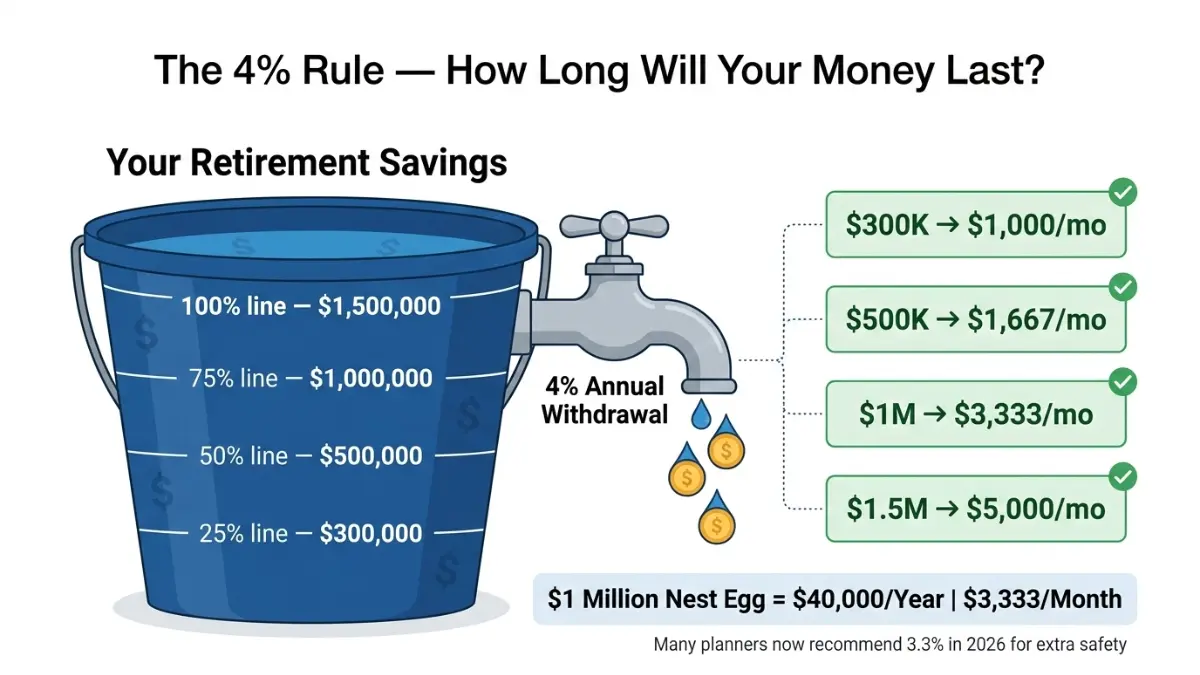
The calculator defaults to 4%. This is based on the famous “4% rule” — a widely-cited benchmark from financial research suggesting you can withdraw 4% of your savings per year and have a high probability of your money lasting 30 years.
Quick 4% Rule Reference Table:
| Retirement Savings | Annual Income (4% Rule) | Monthly Income |
|---|---|---|
| $300,000 | $12,000 | $1,000 |
| $500,000 | $20,000 | $1,667 |
| $750,000 | $30,000 | $2,500 |
| $1,000,000 | $40,000 | $3,333 |
| $1,500,000 | $60,000 | $5,000 |
Many financial planners in 2026 recommend 3.3–3.5% due to longer lifespans and market uncertainty. Adjust the withdrawal rate field in our calculator to test conservative scenarios.
Will Your Savings Last? Real-World Depletion Scenarios
This is what your competitors refuse to show you. Let’s look at four real scenarios — and see exactly when the money runs out.
Retirement Depletion Scenarios (Starting at Age 65, $4,000/month spending, 3% inflation, 5% post-retirement return)
| Scenario | Savings at 65 | Monthly SS Income | Net Monthly Need | Depletion Age |
|---|---|---|---|---|
| Under-saver | $200,000 | $1,927 | $2,073 | ~Age 74 |
| Average saver | $500,000 | $1,927 | $2,073 | ~Age 83 |
| Target saver | $1,000,000 | $1,927 | $2,073 | Age 95+ |
| Power saver | $1,500,000 | $1,927 | $2,073 | Never |
The difference between the under-saver and the power saver is not luck — it’s time + consistency.
How Inflation Silently Destroys Retirement Savings
At 3% annual inflation, $4,000/month today buys the equivalent of $2,207/month in 20 years. Your spending doesn’t go down — your purchasing power does. This is why our retirement calculator includes an inflation field that adjusts your spending needs year-over-year throughout the entire retirement drawdown period.
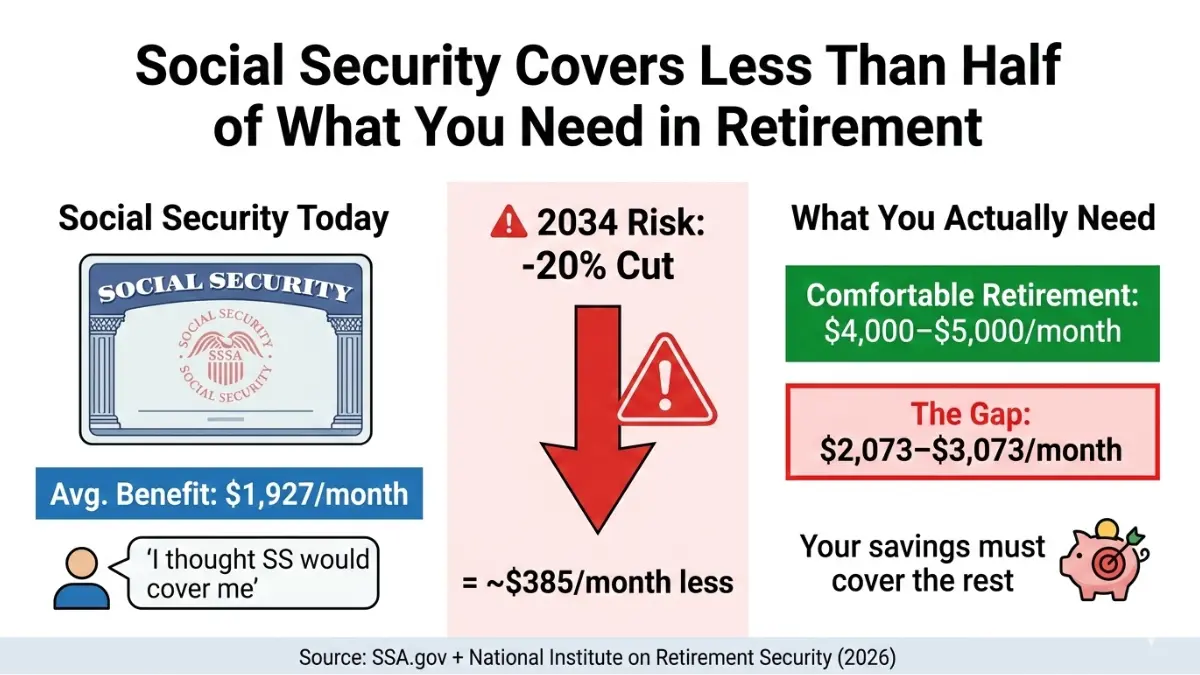
⚠️ Social Security Warning (2026): If Congress doesn’t address Social Security’s funding gap, benefits could be cut by roughly 20% starting around 2034. For anyone retiring after 2030, this must be factored into your retirement savings plan — use a conservative Social Security income estimate in the calculator. You may also want to explore our comprehensive guide to annuities as a way to guarantee a fixed income regardless of Social Security changes.
How to Fix a Retirement Savings Shortfall: Action Plan by Age
Whatever the calculator shows you, there is a path forward. Here’s what to do based on where you are right now.
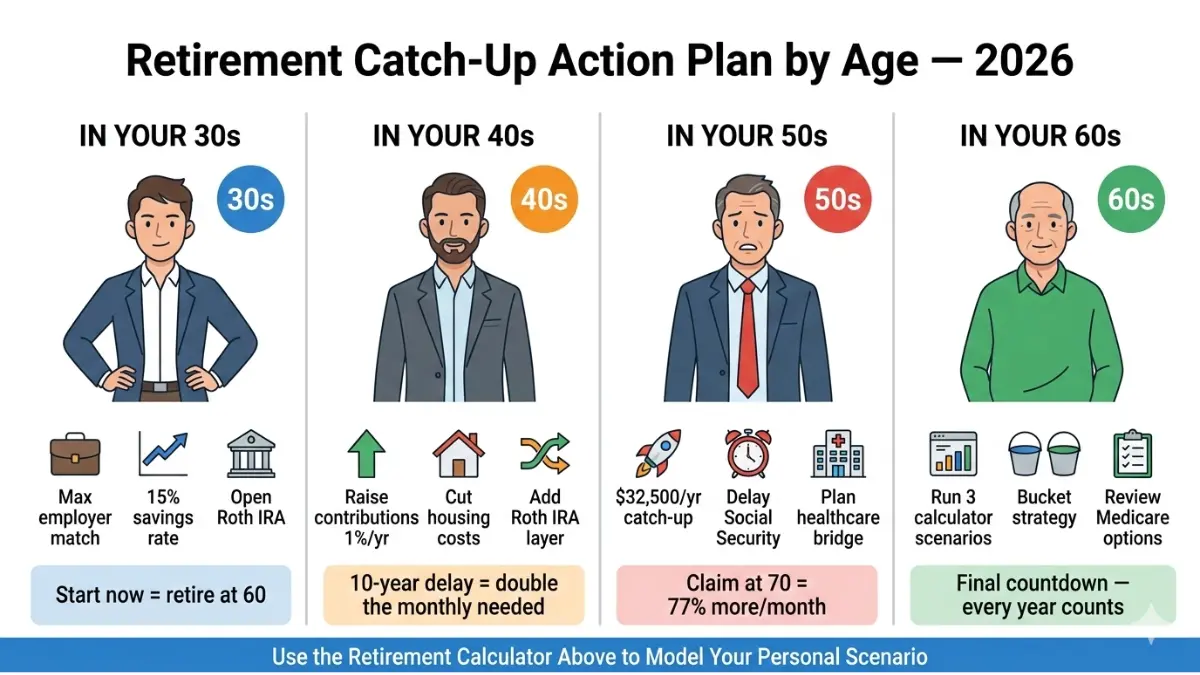
In Your 30s — Build the Foundation
Your greatest weapon is time. Every dollar invested at 30 has 35+ years to compound.
- Maximize your employer’s 401(k) match first — this is a 50–100% instant return on investment
- Target a 15% total savings rate (including employer match)
- Get out of high-interest debt fast — use our debt consolidation calculator to see how consolidating can free up $300–$800/month for retirement
- Open a Roth IRA — contributions grow tax-free and withdrawals in retirement are tax-free
In Your 40s — Accelerate
This is your peak earning decade. Treat it that way.
- Increase your contribution rate by 1% every year — most people don’t notice the paycheck difference, but the compounding impact is enormous
- Reassess your housing costs — use our home affordability calculator to evaluate whether downsizing or refinancing frees up cash flow
- Build a Roth IRA ladder alongside your traditional 401(k) for tax diversification in retirement
- Review your 401(k) vs. IRA strategy — the optimal contribution order matters
In Your 50s — Catch-Up Mode
Participants aged 50 and older can contribute up to $32,500 to a 401(k) in 2026. Those aged 60–63 qualify for a super catch-up, allowing contributions up to $35,750 annually. These limits are your nuclear weapon. Use them.
- Max every available catch-up contribution — this is the single most powerful legal move available to late-starters
- Delay Social Security — claiming at 70 instead of 62 increases your monthly benefit by up to 77% per the SSA
- Model your healthcare bridge — Medicare starts at 65; plan how to cover costs from 60–64
- Check your HSA strategy — HSAs offer triple tax advantages and can fund retirement medical costs
In Your 60s — Final Countdown
- Run multiple scenarios in our retirement calculator — test 3%, 4%, and 4.5% withdrawal rates
- Consider a bucket strategy: 3 years of cash + 7 years in bonds + remainder in stocks
- Review your Medicare Advantage plan options — healthcare is the biggest retirement wildcard
- If you own a home, explore how reverse mortgage options work as a last-resort income supplement
- Use our ROI calculator to evaluate late-stage investment decisions with precision
Frequently Asked Questions — Retirement Calculator
Q1: How much do I need to retire comfortably?
Most financial experts recommend saving 10–12× your final annual salary. On a $70,000 income, that’s $700,000–$840,000. Use the retirement calculator above to get your exact personalized number based on your actual spending and income sources.
Q2: What is a good monthly retirement income?
The typical American retiree needs $4,000–$5,000/month to maintain their pre-retirement lifestyle. Social Security covers roughly $1,927/month on average — meaning most retirees must pull $2,000–$3,000/month from savings.
Q3: What is the 4% rule in retirement?
The 4% rule means withdrawing 4% of your total portfolio in year one, then adjusting that dollar amount for inflation each year. A $1 million nest egg produces roughly $40,000/year. Many planners now suggest 3.3% to account for longer lifespans.
Q4: When should I start using a retirement calculator?
At age 25–30 if possible. Starting contributions at 25 vs. 35 can mean the difference between retiring at 60 or working until 70 — that’s the power of compound interest applied over an extra decade. See our deep guide on retirement planning in your 30s for a full roadmap.
Q5: What investment return should I enter in the retirement calculator?
Use 7% pre-retirement (based on S&P 500 long-term average) and 4–5% during retirement as you shift toward more conservative holdings. These are conservative estimates — not guaranteed.
Q6: Can I retire early at 55?
Yes, but you’ll need a significantly larger nest egg — retirement at 55 means 30+ years of withdrawals with no Social Security until 62 at the earliest. Each year you retire early adds roughly 2 years of spending to your total needs. Run an early retirement scenario in the calculator using life expectancy age 92.
Q7: What if my retirement calculator shows I’ll run out of money?
Don’t panic — act. Your three best levers are: increase monthly contributions, delay retirement by 2–3 years, or reduce projected monthly spending. Even delaying by 2 years both grows your savings and shortens the withdrawal period. See our retirement savings by age guide for catch-up strategies specific to your situation.
Q8: Does this calculator account for Social Security income?
Yes. Enter your estimated monthly Social Security benefit in the “Other retirement income” field. Use the SSA Retirement Estimator to find your personalized projected benefit at different claiming ages.
Q9: Is the 4% withdrawal rate still safe in 2026?
Many advisors now recommend 3.3–3.5% as a safer rate, given longer life expectancies and potential Social Security reductions after 2034. Our calculator lets you test any withdrawal rate you choose — try 3%, 3.5%, and 4% to see how much the depletion age changes.
Q10: How does inflation affect my retirement plan?
At 3% annual inflation, $5,000/month in today’s dollars becomes the equivalent of roughly $2,760/month in purchasing power after 20 years. Our calculator adjusts your spending needs for inflation every single year through the entire drawdown period — most competitor calculators don’t do this.
Q11: What makes this retirement calculator different?
Our calculator supports 22 global currencies, shows a complete year-by-year depletion table, allows CSV export of your full projection, adjusts contributions for annual growth, shows both nominal and inflation-adjusted balances at retirement, and gives you a precise depletion age if you’re on a shortfall path. No registration, no paywall, no ads.
⚖️ Disclaimer: This retirement calculator and all content on this page are provided for educational and informational purposes only. Results are mathematical projections based on the assumptions you enter — they do not constitute financial, investment, tax, or legal advice. Actual investment returns, inflation rates, Social Security benefits, and tax laws may differ materially from the assumptions used. Please consult a qualified, fiduciary financial advisor before making retirement planning decisions. Past performance is not a guarantee of future results.
🔗 Related Tools & Guides:
- 401(k) Calculator — maximize your workplace retirement contributions
- Savings Calculator — project compound growth on any savings goal
- 401(k) Explained — stop leaving free employer money behind
- What is Compound Interest — the single most powerful force in retirement planning
- Roth IRA Complete Guide — save up to $500K tax-free
Informational disclaimer
The content on Finance Authority Hub is provided for general informational and educational purposes only and should not be considered personalized financial, investment, tax, legal, or professional advice. Financial decisions depend on your individual goals, income, risk tolerance, location, and regulatory situation. Before acting on any information, strategy, estimate, or calculator result, consult a qualified licensed professional who can evaluate your specific circumstances.