
Rent vs. Buy Calculator: Stop Guessing in 2026
Rent vs Buy Calculator
Simulate both paths month-by-month and compare estimated net worth over time (home equity minus selling costs vs an investment portfolio funded by upfront cash + monthly savings). This “invest the difference” approach is common in rent-vs-buy methodology. [web:108][web:114]
Inputs
Simple estimator: applies this % to (mortgage interest + property tax). Leave 0 for global neutrality.
Results
Break-even (net worth)
—
Mortgage P&I: —
End net worth (Rent)
—
Rent portfolio: — • Deposit: —
End net worth (Buy)
—
Net sale proceeds: — • Buy portfolio: —
Buy minus rent (end)
—
Positive means buying wins in this model.
Buying basics
Down payment: — (—) • Starting loan: — • Buying closing costs: —
End home value: — • End mortgage balance: — • End equity: — • Selling costs: —
Totals over the horizon (cash outflows)
Total rent paid: — • Total ownership outflows (incl. tax/ins/HOA/maint/PMI, net of tax benefit): —
Interest: — • Principal: — • Property tax: — • Maintenance: — • PMI: — • Tax benefit (est): —
Year-by-year summary (approx net worth)
| Year | Rent paid (year) | Owner outflow (year) | Home value (end) | Mortgage bal (end) | Net sale (end) | Rent portfolio (end) | Buy portfolio (end) | Rent NW (end) | Buy NW (end) |
|---|
Monthly schedule (first 360 months shown)
| Month | Rent outflow | Owner outflow | Home value | Mortgage balance | Equity | Rent portfolio | Buy portfolio | Rent NW | Buy NW |
|---|
Tip: download the CSV to get the full horizon monthly schedule.
Results appear after you click “Calculate.”
In This Article
Should you rent or buy in 2026? At today’s 6.5% mortgage rates, buying beats renting financially only if you stay 5+ years, have a solid down payment, and your local price-to-rent ratio is below 20. If any of those three conditions fail, renting and investing the difference is often the smarter financial move.
Use the rent vs. buy calculator above to get your personalized break-even date in under 60 seconds.
| Your Situation | Quick Verdict |
|---|---|
| Staying 5+ years, stable income, 10%+ down | ✅ Lean Buy |
| Staying under 3 years, job uncertainty | ✅ Lean Rent |
| High-cost city, P/R ratio above 20 | ✅ Lean Rent |
| Planning roots, credit score 700+, P/R under 18 | ✅ Lean Buy |
How to Use This Rent vs. Buy Calculator
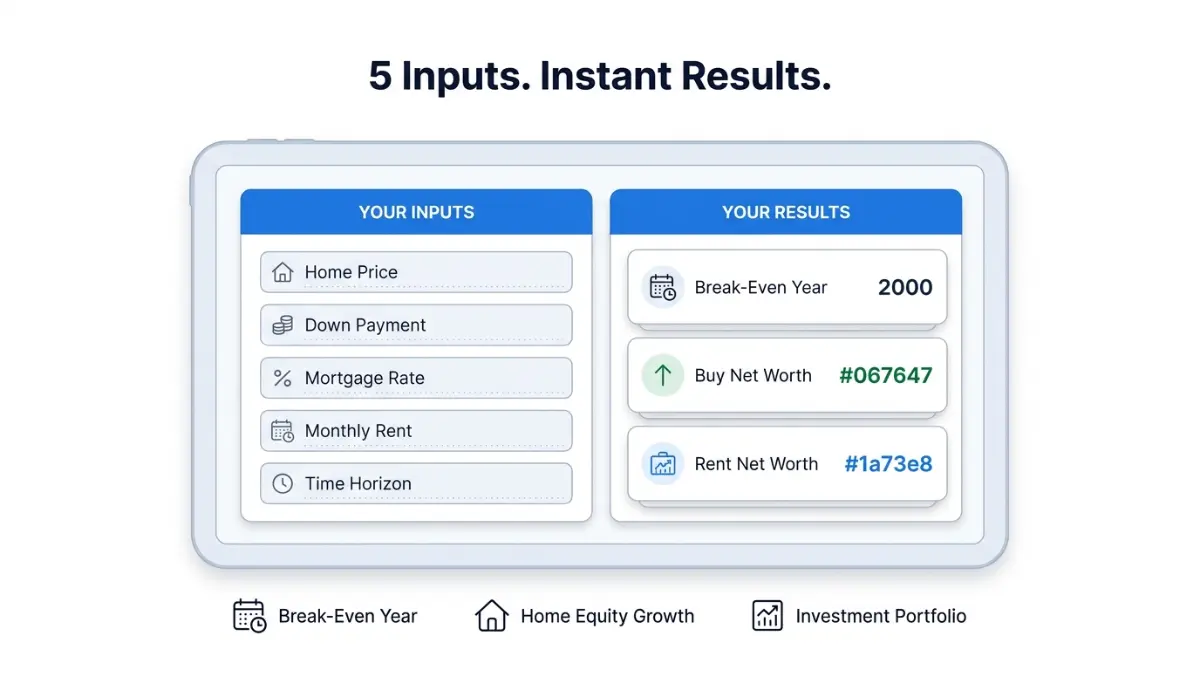
Step-by-Step Input Guide
The rent vs. buy calculator above runs a month-by-month net worth simulation for both paths — buying and renting — simultaneously. Here is exactly what to enter:
- Home Price — Enter the purchase price of the home you are considering, not the listing price.
- Down Payment — Enter either a dollar amount or a percentage. Less than 20% triggers PMI costs automatically.
- Mortgage Rate (APR%) — Use the current 30-year fixed rate. As of March 2026, Freddie Mac reports approximately 6.5%.
- Monthly Rent — Enter what you currently pay, or what you would pay for a comparable home in your target area.
- Time Horizon — How many years do you plan to stay? This single input changes everything.
Pro Tip: Do not leave the Investment Return % field at zero. This field calculates the opportunity cost of your down payment — meaning what that money earns if invested in the stock market instead of locked into home equity. Most competing calculators ignore this entirely.
Understanding Your Results
After you click Calculate, three numbers matter most:
- Break-Even Year — The year when buying’s net worth overtakes renting’s net worth.
- Buy Net Worth vs. Rent Net Worth — The total estimated wealth at your time horizon under each path.
- Buy Minus Rent (End) — Positive means buying wins. Negative means renting and investing wins.
Before running this calculator, it also helps to know your borrowing ceiling. Use our Home Affordability Calculator to confirm how much home you can realistically finance at today’s rates.
Recommended 2026 Default Inputs
| Field | Recommended 2026 Default |
|---|---|
| Mortgage Rate | 6.50% |
| Home Appreciation | 3.0% annually |
| Rent Growth | 3.0% annually |
| Investment Return | 7.0% (S&P 500 historical avg) |
| Maintenance | 1.0% of home value/year |
| Selling Costs | 6.0% of sale price |
| Buying Closing Costs | 2.0–3.0% of home price |
Rent vs. Buy in 2026 — The Real Numbers
2026 Baseline Snapshot
The US housing market in 2026 has reached a new equilibrium — rates are elevated but stable, and rent growth has moderated. Here is the ground truth:
- 30-Year Fixed Mortgage Rate: ~6.5% (Freddie Mac, March 2026)
- US Median Home Price: ~$420,000 (National Association of Realtors)
- Average National Rent (3-bed): ~$2,050/month (Zillow ZORI, 2026)
- Average Annual Home Maintenance Cost: $10,867/year (reported by home services industry surveys)
- Typical Break-Even at Current Rates: 4–6 years in most US markets
Key fact most buyers miss: On a $420,000 home with 10% down ($42,000), your all-in monthly ownership cost — mortgage principal and interest, property tax, insurance, HOA, and maintenance — runs approximately $3,100–$3,400/month. The average comparable rental in the same market runs ~$2,050/month. That is a $1,050–$1,350/month gap in year one that must be recovered through equity and appreciation before buying wins.
True Cost Comparison Table
| Cost Factor | Renting | Buying |
|---|---|---|
| Upfront cost | 1–2 months deposit (~$4,100) | Down payment + closing (~$54,600+) |
| Monthly housing cost | ~$2,050 (rent) | ~$3,200 (all-in ownership) |
| Maintenance | $0 (landlord’s problem) | ~$875/month (1% rule on $420K) |
| Flexibility | Move any time | 5–7 year commitment recommended |
| Wealth building | Investment portfolio | Home equity + appreciation |
| Tax benefit | None | Mortgage interest deduction (if itemizing) |
| Inflation protection | ❌ Rent increases annually | ✅ Fixed mortgage payment |
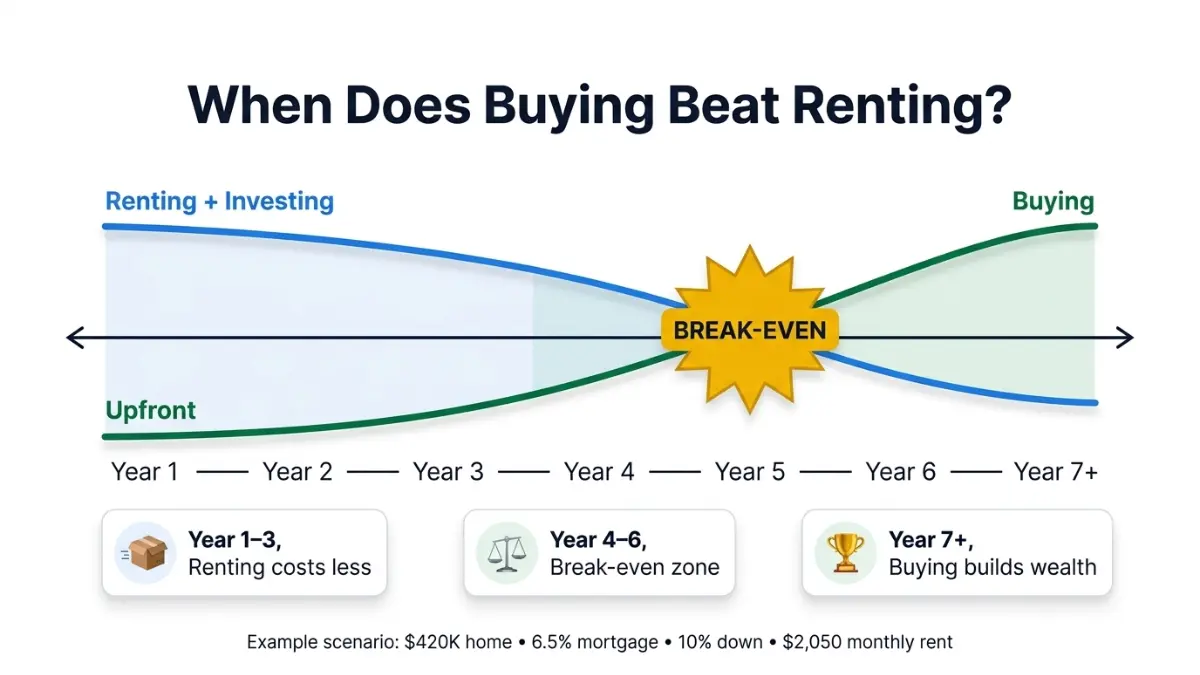
When Does Buying Beat Renting? The Break-Even Reality
Buying costs more every single month in the first years. The question is: how long until equity accumulation and home appreciation flip the math in your favor?
The math at 2026 rates on a $420,000 home (10% down):
- Closing costs (3%): $12,600 upfront
- Selling costs (6%): $25,200 when you sell
- Total transaction drag: ~$37,800 that appreciation must overcome before you profit
At 3% annual appreciation, a $420,000 home gains ~$12,600 in value per year. At that pace, you recover transaction costs in approximately 3 years — but you still need to account for the monthly cost gap versus renting. When all factors are modeled together (as our calculator does), the true break-even in most US markets lands at Year 4–6.
Rule of thumb: If you are not staying at least 5 years, buying at 6.5% rates is rarely the financially optimal move.
For a precise monthly payment picture on your specific loan amount, our Mortgage Calculator gives you an instant principal and interest breakdown.
Price-to-Rent Ratio by City — 2026
The price-to-rent ratio (home price ÷ annual rent) is the single fastest way to assess any market without a calculator. Below 15 = strong buy case. Above 20 = lean toward renting.
| City | Median Home Price | Avg Monthly Rent | P/R Ratio | 2026 Verdict |
|---|---|---|---|---|
| Pittsburgh, PA | $215,000 | $1,452 | 12.3 | ✅ Strong Buy |
| Tampa, FL | $370,000 | $1,750 | 17.6 | ✅ Lean Buy |
| Phoenix, AZ | $415,000 | $1,800 | 19.2 | ⚠️ Borderline |
| Austin, TX | $480,000 | $1,950 | 20.5 | ❌ Lean Rent |
| Denver, CO | $530,000 | $1,927 | 22.9 | ❌ Rent |
| San Francisco, CA | $1,200,000 | $3,200 | 31.2 | ❌ Strong Rent |
Sources: Redfin, Zillow ZORI, local MLS data, March 2026.
P/R formula: Home Price ÷ (Monthly Rent × 12) = Price-to-Rent Ratio
If your city’s ratio exceeds 20, buying requires exceptionally long hold times to break even. Use the Closing Cost Calculator to factor in your exact upfront buying costs before deciding.
The Opportunity Cost Angle — What Competitors Miss
Every major competitor — NerdWallet, Bankrate, Calculator.net — glosses over this in their editorial content. Opportunity cost is the most underestimated variable in the rent vs. buy decision.
Here is the concrete example:
- 20% down payment on a $420,000 home = $84,000
- If that $84,000 is instead invested in a diversified index fund at 7% annual return:
- After 10 years: ~$165,000
- After 20 years: ~$325,000
Your home must appreciate enough to beat that investment return — plus cover all ownership costs — for buying to win purely on a wealth-building basis. According to Federal Reserve Economic Data (FRED), US home prices have averaged approximately 4–5% annual appreciation historically, which means a well-chosen home in a high-demand market can compete — but it is never a guaranteed win.
This is exactly why our calculator’s Investment Return % field exists. It runs both scenarios side by side so you see the real wealth comparison, not just the monthly payment comparison.
Should You Rent or Buy? Your 2026 Decision Framework
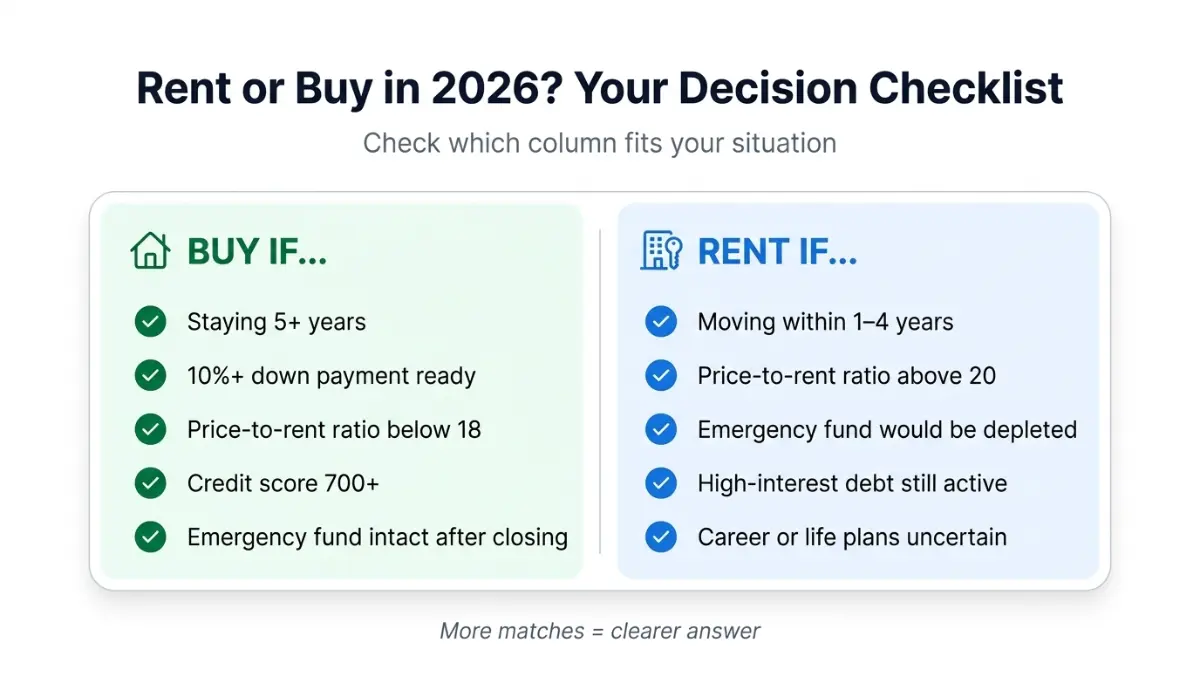
Buy If These Apply to You
Buying makes strong financial sense in 2026 when:
- ✅ You plan to stay in the home 5 or more years
- ✅ Your down payment is 10% or more (20% eliminates PMI entirely)
- ✅ Your local price-to-rent ratio is below 18
- ✅ Your credit score is 700 or above (qualifies for better mortgage rates)
- ✅ You have 3–6 months of emergency savings remaining after closing
- ✅ Your monthly ownership costs are less than 30% of gross income
Check your debt obligations first. Our Debt-to-Income Ratio Calculator tells you exactly where you stand before a lender does — and lenders reject most applications with a DTI above 43%.
Bold Takeaway: The 5-Year Rule is non-negotiable at 6.5% rates. Transaction costs alone (buying + selling) can reach 10% of the home’s value. You need time for appreciation to absorb that drag.
Rent If These Apply to You
Renting is the smarter financial move in 2026 when:
- ✅ You expect to move within 1–4 years (career change, relocation, life stage)
- ✅ Your local price-to-rent ratio exceeds 20
- ✅ Your emergency fund would drop below 3 months of expenses after a down payment
- ✅ You carry significant high-interest debt that should be paid first
- ✅ You value geographic flexibility for career or lifestyle reasons
- ✅ The mortgage payment would exceed 35% of your gross monthly income
Bold Takeaway: Renting is not throwing money away. Rent buys you housing, zero maintenance liability, full flexibility, and — critically — the ability to invest the difference in wealth-building assets. The Consumer Financial Protection Bureau’s homeownership guide confirms that readiness, not urgency, should drive the buy decision.
The “Invest the Difference” Strategy
This is the framework our calculator is built on — and what separates it from every basic rent vs. buy tool online.
How it works:
- Calculate the monthly cost gap between owning and renting (typically $800–$1,400/month in most US markets in 2026)
- A renter invests that difference monthly into a diversified portfolio
- The calculator tracks both paths — buyer’s growing equity vs. renter’s growing investment portfolio
- The winner is whoever has the higher net worth at your chosen time horizon
Real example: If owning costs $3,200/month and renting costs $2,050/month, the renter has $1,150/month to invest. At 7% annual return over 10 years, that is $198,000+ in investment wealth — a figure that competes directly with home equity in many markets.
Use our Compound Interest Calculator to model exactly how your invested “difference” grows over any time horizon.
If you are currently carrying debt before considering a home purchase, tackle that first. Our Debt Consolidation Calculator shows you the fastest path to debt-free status so your finances are mortgage-ready.
What This Means For You — Action Steps
Before you decide, complete these three steps:
- Run the calculator above with your actual numbers — home price, current rent, time horizon, and investment return.
- Check your city’s price-to-rent ratio using the table above.
- Stress-test your finances — use our Home Affordability Calculator to confirm your maximum safe purchase price.
What Happens After You Decide to Buy
The True Cost of Homeownership — Hidden Numbers
Most first-time buyers budget only for the mortgage payment. That is a critical mistake. Here is the full ownership cost picture for a $420,000 home in 2026:
| Ownership Cost | Monthly Estimate |
|---|---|
| Mortgage P&I (6.5%, 30yr, 10% down) | ~$2,390 |
| Property Tax (1.2% avg) | ~$420 |
| Homeowners Insurance | ~$175 |
| PMI (if < 20% down, ~0.6%) | ~$189 |
| Maintenance (1% rule) | ~$350 |
| HOA (if applicable) | $0–$400 |
| Total All-In | ~$3,100–$3,500 |
Homeowners insurance deserves special attention — our detailed Homeowners Insurance guide shows how to stop overpaying on this recurring cost, which most buyers grossly underestimate.
Down Payment Strategy in 2026
The down payment is the single largest barrier for most buyers. In 2026, these are your primary options:
- 3% down — Conventional loan (Fannie Mae HomeReady, Freddie Mac Home Possible)
- 3.5% down — FHA loan (credit score 580+)
- 0% down — VA loan (eligible veterans) and USDA loan (rural areas)
- 20% down — Eliminates PMI, lowest total interest cost
According to the U.S. Department of Housing and Urban Development, down payment assistance programs are available in all 50 states and can provide $5,000–$25,000 in grants or low-interest loans for qualifying buyers. Our comprehensive Down Payment Help Guide covers every major assistance program available in 2026.
Use our Down Payment Calculator to determine exactly how much you need to save — and by when — to hit your target purchase date.
Mortgage Type Comparison
Not all mortgages are equal. The type you choose directly impacts your rent vs. buy calculation.
| Mortgage Type | Rate Range (2026) | Best For |
|---|---|---|
| 30-Year Fixed | 6.25–6.75% | Long-term stability, lower monthly payment |
| 15-Year Fixed | 5.75–6.25% | Lower total interest, faster equity |
| 5/1 ARM | 5.50–6.00% | Short-term holds under 7 years |
| FHA (30-Year) | 6.00–6.50% | First-time buyers, lower credit scores |
| VA (30-Year) | 5.75–6.25% | Veterans — best overall terms |
Our 15 vs. 30 Year Mortgage Comparison breaks down the exact total interest cost difference and which term wins for different financial profiles.
Expert Insights — What Finance Professionals Say in 2026
Our panel of credentialed financial experts at FinanceAuthorityHub.com shared the following consensus views on the 2026 rent vs. buy decision.
Expert Panel Consensus
Laura M. Bennett, CFP — On Opportunity Cost: “The biggest mistake buyers make is comparing the mortgage payment to rent and stopping there. The true comparison must include what your down payment earns if invested. At historical S&P 500 returns, that opportunity cost is substantial. Run the full model before you sign anything.”
Daniel Moreau, CPA/CFP — On Tax Implications: “The mortgage interest deduction matters less in 2026 than most buyers assume. With the standard deduction at $14,600 (single) and $29,200 (married filing jointly), most homeowners no longer itemize — meaning the mortgage interest deduction delivers zero tax benefit for the majority of buyers. Factor this realistically into your numbers.” (Source: IRS Publication 936 — Home Mortgage Interest Deduction)
Michael R. Thompson, CFA — On Portfolio Risk: “A home is not a diversified investment. It is a single, illiquid, leveraged asset in one geographic location. For buyers who are already maxing their 401(k) and building a Roth IRA, adding a home can make sense. For those who would skip retirement contributions to afford a mortgage, the math rarely pencils out in their favor.”
Expert Consensus Table
| Key Decision Factor | Expert Panel Verdict |
|---|---|
| Minimum recommended hold time | 5 years (unanimous) |
| Always model opportunity cost | ✅ Critical — all three experts agree |
| P/R ratio above 20 = caution | ✅ Proceed only with 7+ year horizon |
| Waiting for 3% rates to return | ❌ Not advisable — “marry the home, date the rate” |
| Skip retirement savings to buy | ❌ Strongly cautioned against |
| Tax deduction value in 2026 | ⚠️ Lower than most buyers expect |
If you are approaching retirement and weighing a home purchase against other assets, our Retirement Planning Guide and Retirement Calculator help you model the full long-term picture.
Rent vs. Buy Calculator — Frequently Asked Questions
Q1. Is it better to rent or buy in 2026?
In most US markets, buying makes more financial sense if you stay 5+ years, have a 10%+ down payment, and your price-to-rent ratio is below 20. At 6.5% rates, renting wins in the short term in nearly every market. Run the calculator above for your personal verdict.
Q2. What is the break-even point for buying a home vs. renting?
At 2026 mortgage rates, the break-even point is typically 4–6 years in most US markets. This accounts for upfront closing costs (2–5%), selling costs (6%), and the monthly cost gap between owning and renting. High-cost cities like San Francisco and Denver can push break-even to 8–10 years.
Q3. How does the rent vs. buy calculator work?
It simulates two parallel financial paths month by month. The buying path tracks mortgage amortization, home equity growth, appreciation, and all ownership costs. The renting path invests the down payment and monthly savings difference into a portfolio. The result is a net worth comparison at your chosen time horizon.
Q4. What is the price-to-rent ratio and how do I use it?
Price-to-Rent Ratio = Home Price ÷ Annual Rent. Below 15 = strong buy case. 15–20 = neutral, depends on your hold time. Above 20 = lean toward renting. Pittsburgh (12.3) is one of the strongest buy markets in the US right now. San Francisco (31.2) strongly favors renting.
Q5. What is opportunity cost in a rent vs. buy decision?
Opportunity cost is what your down payment and monthly savings could have earned if invested instead. A $84,000 down payment at 7% annual return becomes ~$165,000 in 10 years. If your home does not appreciate enough to beat that, renting and investing was the wealthier path.
Q6. How much down payment do I need in 2026?
Minimum requirements: 3% conventional, 3.5% FHA, 0% VA/USDA. However, less than 20% down triggers PMI, which adds $100–$300/month to your ownership cost. Use our Down Payment Calculator to model the exact savings timeline you need.
Q7. Does renting mean I’m throwing money away?
No. This is one of the most persistent myths in personal finance. Rent pays for housing, flexibility, and zero maintenance risk. When invested wisely, the money saved by renting — versus the higher cost of owning — can build substantial wealth. Renting is a financial strategy, not a financial failure.
Q8. What mortgage rate should I enter in the calculator?
Use the current 30-year fixed average from Freddie Mac’s Primary Mortgage Market Survey. As of March 2026, that rate is approximately 6.5%. If you have excellent credit (760+), your actual offered rate may be 0.25–0.50% lower.
Q9. What is PMI and when does it go away?
Private Mortgage Insurance (PMI) protects the lender when your down payment is below 20%. It costs approximately 0.5%–1.0% of the loan balance annually ($150–$300/month on a $378,000 loan). PMI is automatically cancelled once you reach 20% equity — either through payments, appreciation, or both.
Q10. What is the 5% rule for renting vs. buying?
The 5% rule (popularized by financial analyst Ben Felix) states: multiply the home price by 5% and divide by 12. If that number exceeds your monthly rent, renting is likely the better financial choice. Example: $420,000 × 5% ÷ 12 = $1,750/month. If your rent is below $1,750, renting wins financially.
Q11. Should I buy a home before or after paying off debt?
Generally, pay off high-interest debt first. Credit card debt at 20%+ APR is a guaranteed 20% return when paid off — no home appreciates that fast. Use our Debt Consolidation Calculator to find the fastest path to a clean balance sheet before applying for a mortgage.
Disclaimer
This rent vs. buy calculator and all accompanying content are provided for educational and informational purposes only. Nothing on this page constitutes financial, legal, mortgage, or tax advice. All calculator results are estimates based on user-provided inputs and assumed growth rates. Actual outcomes will vary based on local market conditions, interest rate changes, personal financial circumstances, and other factors outside our control. Consult a licensed financial advisor, mortgage professional, or tax advisor before making any home buying, renting, or investment decisions. FinanceAuthorityHub.com and its expert contributors are not responsible for decisions made based on this calculator or content.

Informational disclaimer
The content on Finance Authority Hub is provided for general informational and educational purposes only and should not be considered personalized financial, investment, tax, legal, or professional advice. Financial decisions depend on your individual goals, income, risk tolerance, location, and regulatory situation. Before acting on any information, strategy, estimate, or calculator result, consult a qualified licensed professional who can evaluate your specific circumstances.