Closing Cost Calculator: Avoid $15K Surprises (2026)
Closing Cost Calculator
Build an itemized closing-cost estimate (fees vs prepaids/escrow) and an “estimated cash to close” number after credits, deposits, and any fees rolled into the loan.
Inputs
Tip: Use “Estimate mode” for quick planning, then switch to Itemized when you get quotes.
Closing costs often include lender fees, title services, appraisal, and government recording/taxes; prepaids/escrow funding can include insurance, taxes, and prepaid interest. [web:122][web:132]
Prepaid items can include homeowners insurance, property taxes, and prepaid interest; these are often paid upfront even though they relate to future periods. [web:132][web:129]
“Cash to close” is often described as total costs due at closing plus down payment, minus credits/deposits, and minus any fees rolled into the loan. [web:130][web:119]
Results
Estimated cash to close
—
Deal: —
Closing costs (fees)
—
Prepaids/escrow funding: —
Total costs at closing (no down payment)
—
Credits: − — • Deposits paid: − —
Loan + down payment
Price/value: —
Down payment: — (—)
Base loan: —
If you finance fees
Fees financed: — • Effective loan: — • LTV: —
This is a planning estimate; official figures come from your lender/settlement statement.
Category breakdown
| Category | Items | Subtotal | % of total |
|---|
Itemized table
| Kind | Category | Item | Amount | % of price | % of effective loan |
|---|
Results appear after you click “Calculate.”
In This Article
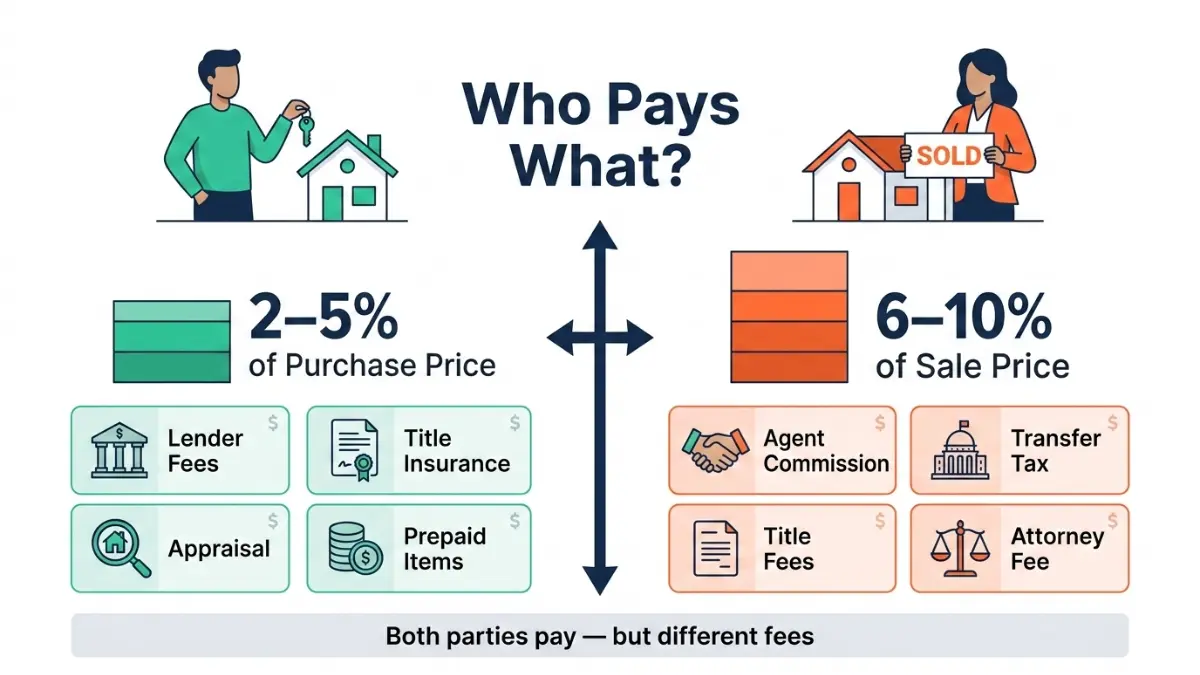
Closing costs average 2–5% of the home price for buyers and 6–10% for sellers — on a $300,000 purchase, that means $6,000 to $15,000 due at the closing table, on top of your down payment. Use the free closing cost calculator above to estimate your exact fees in under 60 seconds.
📊 2026 Quick Reference — Know Your Numbers Before You Read Further
| Metric | 2026 Figure |
|---|---|
| National average closing costs (buyers) | ~$6,900 (excl. prepaid items) |
| Buyer closing costs range | 2–5% of purchase price |
| Seller closing costs range | 6–10% of sale price |
| Highest average state | Washington D.C. — $17,545 |
| Lowest average state | South Dakota — $1,551 |
| Avg. savings from shopping 3+ lenders | $1,000–$3,000 |
| Avg. seller concession in 2024 | 24% of sellers offered one |
What This Means For You: On a $400,000 home, your closing costs could range from $8,000 to $20,000. That’s money you need in addition to your down payment. Most first-time buyers get blindsided by this. You won’t.
What Are Closing Costs? (The Answer in 60 Words)
Closing costs are the fees and expenses required to finalize a real estate transaction. They are separate from your down payment and must typically be paid in cash at the closing table.
They fall into three buckets:
- Lender fees — origination, underwriting, credit report
- Third-party fees — appraisal, title insurance, escrow, attorney
- Prepaid items — property taxes, homeowners insurance, prepaid interest
According to the Consumer Financial Protection Bureau (CFPB), your lender must provide a Loan Estimate within 3 business days of your mortgage application — detailing every closing cost line by line. Request it from at least 3 lenders before committing.
Before calculating closing costs, use our home affordability calculator to confirm you have the total cash needed — down payment plus closing costs combined.
Complete Closing Cost Breakdown: Buyer vs. Seller (2026)
This is the section every competitor gets wrong. NerdWallet only shows buyer fees. Zillow shows zero breakdown. Here’s the full picture.
🏠 Buyer Closing Costs — Full Itemized Table
| Fee | Typical 2026 Cost | Fixed or Negotiable? |
|---|---|---|
| Loan Origination Fee | 0.5–1% of loan amount | ✅ Negotiable |
| Underwriting Fee | $400–$600 | ✅ Negotiable |
| Appraisal Fee | $400–$700 | ❌ Fixed |
| Credit Report Fee | $25–$75 | ❌ Fixed |
| Home Inspection | $300–$600 | ✅ Shop Around |
| Title Insurance (Lender’s) | 0.5% of price | ✅ Shop Around |
| Owner’s Title Insurance | 0.5–1% of price | ✅ Optional but recommended |
| Escrow / Settlement Fee | $350–$1,000 | ✅ Negotiable |
| Recording Fees | $20–$250 | ❌ Fixed (govt.) |
| Flood Certification | $15–$25 | ❌ Fixed |
| Prepaid Interest | Varies by close date | ⚡ Timing = savings |
| Property Tax Reserves | 2–8 months’ taxes | ❌ Fixed |
| Homeowners Insurance (1st yr) | $800–$1,500 | ✅ Shop Around |
Total estimated buyer closing costs: $6,000–$15,000 on a $300K home.
🏡 Seller Closing Costs — What Sellers Actually Pay
Many sellers forget they pay closing costs too — often far more than buyers.
| Fee | Typical 2026 Cost |
|---|---|
| Real Estate Agent Commission | 5–6% of sale price |
| Owner’s Title Insurance | $500–$1,500 |
| State Transfer / Excise Tax | 0–2.2% (varies by state) |
| Attorney Fees | $500–$1,500 |
| Prorated Property Taxes | Varies by close date |
| HOA Transfer Fee | $200–$500 |
| Settlement / Escrow Fee | $300–$800 |
On a $450,000 sale, sellers can expect to pay $27,000–$45,000 in total closing costs.
Key Takeaway: Seller closing costs are dominated by agent commissions. Since the 2024 NAR settlement, commission structures are now negotiable — more on this in Section 5.
🔑 Which Fees Are Negotiable vs. Fixed?
You CAN negotiate:
- Loan origination fee (biggest opportunity — up to $3,000 in savings)
- Underwriting and processing fees
- Title insurance (shop 3+ companies — rates vary 20–40%)
- Escrow / settlement fees
- Real estate agent commissions (post-NAR settlement)
You CANNOT negotiate:
- Government recording fees
- Transfer taxes
- Appraisal fees (though you choose timing)
- Property tax reserves
Closing Costs by Loan Type + Real 2026 Case Study
Not all mortgages cost the same to close. Choosing the right loan type can save you thousands before you sign a single document.
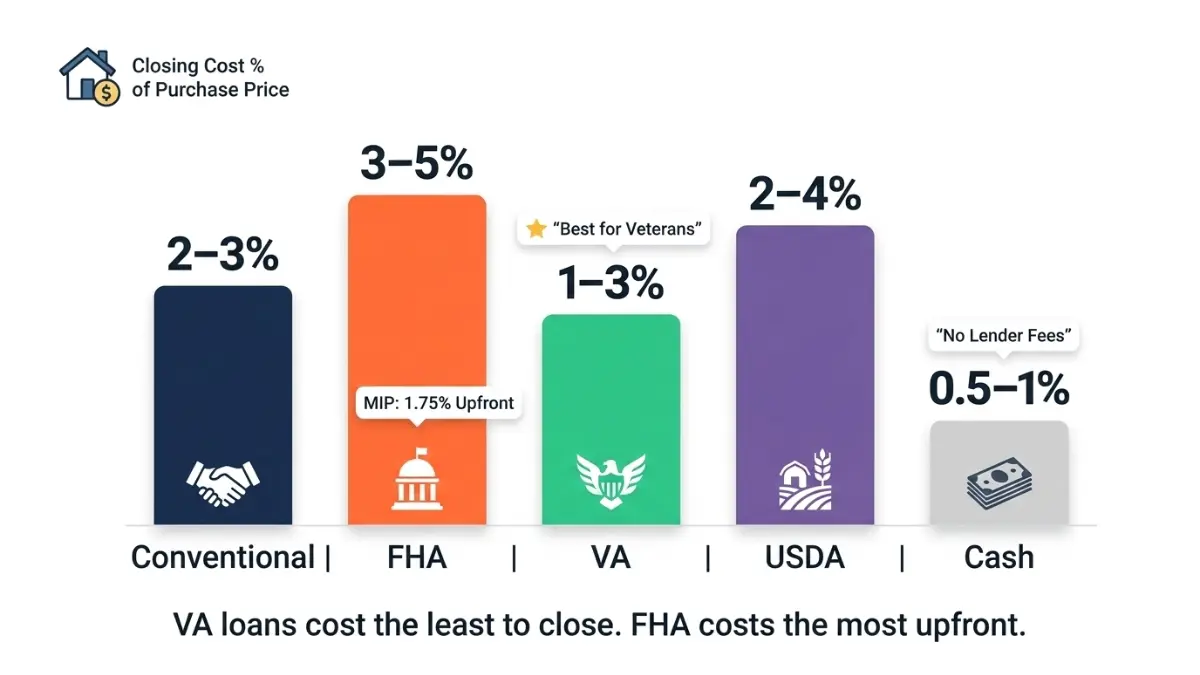
Loan Type Comparison Table (2026)
| Loan Type | Avg. Closing Costs | Key Unique Fee | Seller Concession Limit |
|---|---|---|---|
| Conventional | 2–3% of purchase price | PMI if <20% down | 3–9% (LTV-based) |
| FHA | 3–5% of purchase price | Upfront MIP: 1.75% | Up to 6% |
| VA | 1–3% of purchase price | VA Funding Fee: 1.25–3.3% | Up to 4% |
| USDA | 2–4% of purchase price | Guarantee Fee: 1% | Up to 6% |
| Cash Purchase | 0.5–1% of purchase price | No lender fees | N/A |
Key 2026 Insights:
- FHA loans allow the 1.75% upfront MIP to be rolled directly into the loan balance, reducing cash needed at closing.
- VA loans are the most cost-efficient — no owner’s title insurance required in most states, and the funding fee can also be financed.
- USDA loans offer some of the lowest out-of-pocket costs for eligible rural buyers.
Use our mortgage calculator to run your monthly payment estimates alongside closing cost projections for each loan type.
📋 Real Case Study: Sarah, First-Time Buyer in Columbus, Ohio (2026)
Scenario: Sarah purchased a $320,000 home with 10% down using a Conventional loan at 6.75%.
Initial closing cost estimate from calculator: $9,460 (2.96%)
Here’s how she reduced that by $1,190 using two strategies:
| Strategy Used | Action | Saving |
|---|---|---|
| Lender shopping | Compared 3 Loan Estimates, negotiated origination fee | -$800 |
| Close date optimization | Closed on the 29th instead of 15th of month | -$390 in prepaid interest |
| Total saved | $1,190 |
Final cash to close: $8,270 — without reducing her offer price by a single dollar.
What This Means For You: Two simple timing and negotiation moves saved Sarah nearly $1,200. Both strategies take less than 30 minutes to implement.
Closing Costs by State + The 7-Move Savings Playbook
Where you buy dramatically changes what you pay. State transfer taxes are the single biggest variable in your closing cost total.
Highest vs. Lowest Closing Cost States (2026)
| Rank | Highest States | Avg. Closing Costs | Lowest States | Avg. Closing Costs |
|---|---|---|---|---|
| 1 | Washington D.C. | $17,545 | South Dakota | $1,551 |
| 2 | Delaware | $12,157 | Iowa | $1,640 |
| 3 | New York | $10,800+ | Missouri | $1,740 |
| 4 | Maryland | $9,500+ | Indiana | $1,909 |
| 5 | Hawaii | $8,800+ | North Dakota | ~$2,000 |
Why such a gap? States like New York, Maryland, and Delaware impose heavy transfer and recordation taxes — sometimes 1–2.2% of the home price. States like Texas, Florida, and Arizona charge zero transfer tax, keeping total costs far lower.
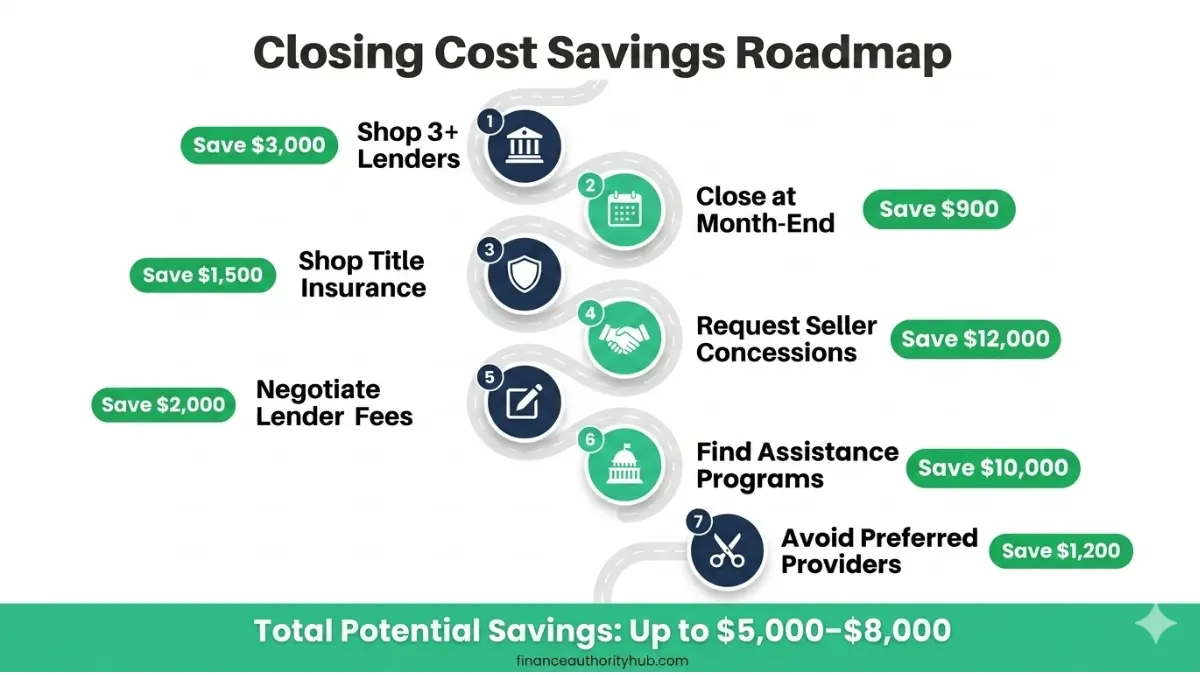
💰 The 7-Move Savings Playbook — Cut Closing Costs by Up to $5,000
This playbook is what every competitor fails to provide. Most sites give 2–3 vague tips. Here are 7 verified, actionable moves with real dollar estimates.
Move 1: Shop At Least 3 Lenders Origination and underwriting fees vary by $1,000–$3,000 for the identical loan. Request Loan Estimates from at least 3 lenders and compare them line-by-line — not just the interest rate. Potential saving: $1,000–$3,000
Move 2: Close at Month-End Prepaid interest accrues from your closing date to the end of that month. Closing on the 28th instead of the 10th means paying 2 days of interest instead of 21. Potential saving: $300–$900 depending on loan size
Move 3: Get 3 Title Insurance Quotes Title insurance rates vary 20–40% between companies for the same policy. You have the legal right to choose your own provider — lenders cannot force you to use their preferred vendor. Potential saving: $500–$1,500
Move 4: Request Seller Concessions In 2024, 24% of home sellers offered some form of concession to buyers according to the National Association of Realtors. In a balanced or buyer’s market, asking for 2–3% in seller concessions is standard practice.
Limits by loan type:
- Conventional: 3–9% (based on down payment)
- FHA: up to 6%
- VA: up to 4%
- USDA: up to 6%
Pro move: Offer full asking price and request 3% seller concession = $12,000 back at closing on a $400K home, with no change to the seller’s net. Potential saving: $4,000–$12,000
Move 5: Negotiate Lender Fees Directly Origination fees, underwriting fees, and processing fees are NOT fixed. Lenders can waive or reduce these to earn your business — especially if you have good credit. Potential saving: $500–$2,000
Move 6: Find Closing Cost Assistance Programs The U.S. Department of Housing and Urban Development (HUD) administers programs and grants for first-time homebuyers in every state. Many offer $2,500–$10,000 in closing cost assistance. Potential saving: $2,500–$10,000 for eligible buyers
Move 7: Avoid Lender-Referred “Preferred” Providers Lender-referred vendors are legally only a suggestion — not a requirement. These vendors often charge 20–30% more than independently sourced alternatives. Always get competing quotes for title, escrow, and inspection services. Potential saving: $400–$1,200
💡 Bold Callout: Implementing all 7 moves on a $400K purchase can realistically save $3,500–$8,000 — without reducing your offer or changing your loan terms.
If you’re still building toward a down payment alongside closing costs, our down payment calculator can map out exactly how long it takes to save for both at your current rate.
2026 Update: How the NAR Settlement Changed Everything
This is the section no competitor has. It’s the biggest structural change to closing costs in a generation.
🔔 What Happened in 2024
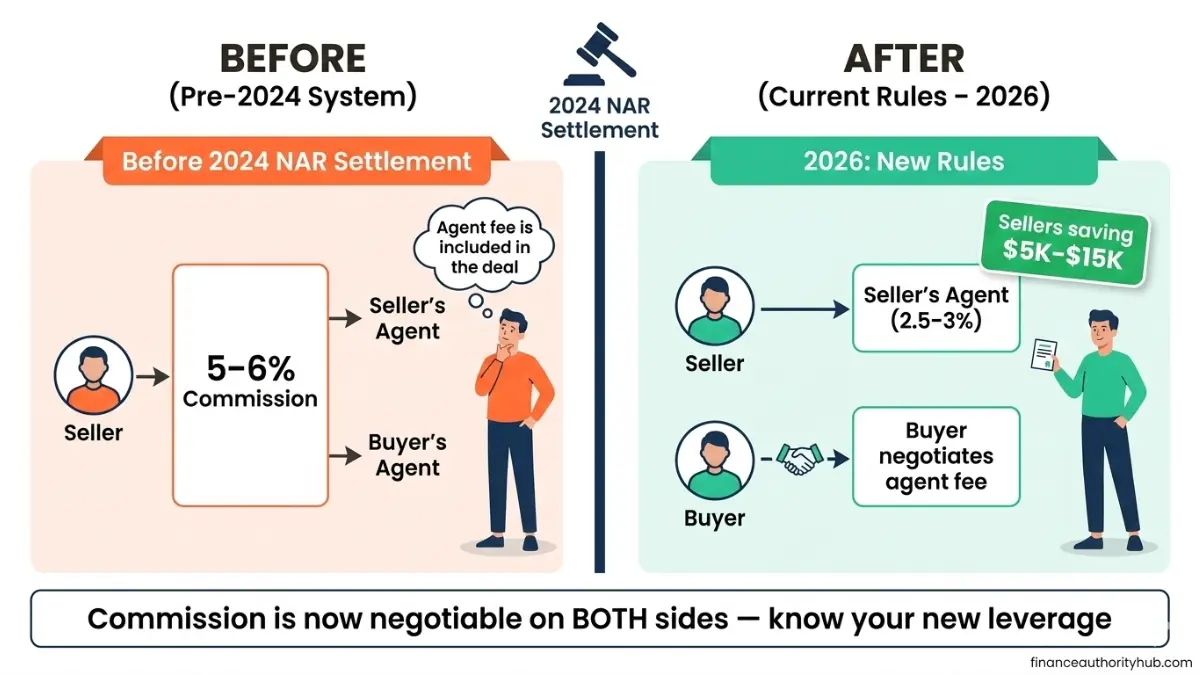
The National Association of Realtors reached a landmark settlement in March 2024, fundamentally restructuring how real estate commissions work. Starting August 2024, buyer agent commissions can no longer be included in MLS listings. Buyers now negotiate their agent’s fee directly and separately.
What Changed for Buyers in 2026
- Buyers must sign a written buyer-broker agreement before touring homes
- Agent fees (typically 2–3%) are now a separate negotiation — not automatically embedded
- FHA and VA loan guidelines were updated in 2024 to allow buyers to pay their own agent fee without it counting toward loan-specific cost caps
- Some buyers are now paying 0% buyer agent commission in strong buyer’s markets
What Changed for Sellers in 2026
- Sellers are no longer obligated to offer buyer agent compensation through MLS
- Commission is now fully negotiable on both sides of the transaction
- Net proceeds for sellers have increased in many markets as a result
- Sellers using discount brokerages (e.g., 1.5% listing fee services) are now saving $5,000–$15,000 compared to traditional structures
Expert Panel: Credentialed Finance Professionals Weigh In
“The NAR settlement fundamentally altered the cash-to-close calculation for buyers in 2026. First-time buyers especially need an updated closing cost calculator that reflects agent fee flexibility — the old ‘budget 3% and you’re fine’ rule no longer applies in many markets.” — Laura M. Bennett, CFP®, Senior Financial Advisor, financeauthorityhub.com
“In markets like New York and California, the combined effect of higher transfer taxes and the new agent fee structure means buyers should budget 5–6% of purchase price for total closing costs in 2026 — not the outdated 2–3% estimate still circulating online.” — Daniel Moreau, CPA/CFP®, Tax & Mortgage Specialist, financeauthorityhub.com
The CFPB’s closing disclosure guide confirms lenders must provide the final cost breakdown at least 3 business days before closing — use this window to review every line and challenge anything unexpected.
If you’re planning to refinance after settling in, check your potential savings with our mortgage refinance calculator — refi closing costs (typically 2–3% of the remaining loan) are often overlooked in the excitement of buying.
Frequently Asked Questions (2026)
1: How much are average closing costs in 2026?
Average closing costs are $6,000–$15,000 for buyers (2–5% of purchase price) and $27,000–$45,000 for sellers on a $450K sale (6–10%). National average for a single-family buyer purchase is approximately $6,900 excluding prepaid items, and rising due to higher home values.
2: Who pays closing costs — the buyer or the seller?
Both parties pay — different fees. Buyers cover lender fees, title insurance, appraisal, and prepaid items. Sellers cover agent commissions, transfer taxes, and their share of title and escrow fees. Which party pays what can also vary by state custom and negotiation.
3: Can closing costs be rolled into the mortgage?
In some cases, yes. FHA loans allow the 1.75% upfront MIP to be financed into the loan. Some lenders offer “no-closing-cost” loans in exchange for a higher interest rate. However, financing closing costs increases your loan balance and total interest paid over the life of the loan.
4: What closing costs are negotiable?
Origination fees, underwriting fees, title insurance, and escrow fees are negotiable. Government-set recording fees and transfer taxes are fixed. Shopping multiple lenders and requesting seller concessions are the two most powerful ways to reduce your total.
5: What is a Loan Estimate and when do I get one?
A Loan Estimate is a 3-page standardized form your lender must provide within 3 business days of your mortgage application. Per the CFPB’s Loan Estimate guide, it itemizes all estimated closing costs. Compare at least 3 Loan Estimates side by side before choosing a lender.
6: How do seller concessions work?
Seller concessions are closing costs the seller agrees to pay on your behalf. Limits vary: FHA (6%), VA (4%), Conventional (3–9% based on LTV). They cannot be applied toward your down payment — only toward closing costs and prepaid items. In a balanced 2026 market, requesting 2–3% concessions is a standard and reasonable negotiation.
7: What is “cash to close” vs. closing costs?
Closing costs are the fees due at settlement. Cash to close is the total you bring to the table — down payment + all closing costs, minus any credits, concessions, or earnest money already paid. Our closing cost calculator shows both figures. Run your full monthly payment alongside this using our amortization calculator.
8: Are any closing costs tax deductible?
Mortgage discount points and prorated property taxes may be deductible in your purchase year. Origination fees and title insurance generally are not. Consult a qualified tax professional for guidance specific to your situation. Our 2026 tax brackets guide explains deduction thresholds that may apply.
9: Which states have the lowest closing costs?
South Dakota ($1,551), Iowa ($1,640), Missouri ($1,740), Indiana ($1,909), and North Dakota (~$2,000) consistently rank lowest. States without transfer taxes — including Texas, Florida, and Arizona — also rank among the most affordable for closing costs.
10: Can I use gift money to pay closing costs?
Yes. Most loan types allow gift funds from family members to cover closing costs. Lenders require a signed gift letter confirming the funds are not a loan. FHA and VA loans are particularly flexible about gift fund sources and documentation.
11: How does your closing date affect total costs?
Prepaid interest accrues daily from your closing date to the end of that month. Closing on the 28th instead of the 5th means paying 2 days of interest instead of 26. On a $300,000 loan at 6.75%, that difference is roughly $750 saved — simply by choosing your close date strategically.
⚠️ Disclaimer: This article is for educational and informational purposes only and does not constitute financial, legal, or mortgage advice. Closing cost estimates vary by state, lender, loan type, and individual transaction. Always request a Loan Estimate from a licensed lender and consult a qualified financial professional before making any home purchase decision. financeauthorityhub.com is not a mortgage lender, broker, or financial advisor. Data sourced from the CFPB, HUD, NAR, and ClosingCorp (2026).
Informational disclaimer
The content on Finance Authority Hub is provided for general informational and educational purposes only and should not be considered personalized financial, investment, tax, legal, or professional advice. Financial decisions depend on your individual goals, income, risk tolerance, location, and regulatory situation. Before acting on any information, strategy, estimate, or calculator result, consult a qualified licensed professional who can evaluate your specific circumstances.