Index Funds vs Mutual Funds: Which Wins 2026?
Over $612 billion flowed into index funds in 2025 while active mutual funds saw outflows. Discover which wins for YOUR situation with real data, tax calculators, and case studies.

In This Article
Over $612 billion flowed into index funds in 2025, while actively managed mutual funds saw $89 billion in outflows—a seismic shift that reflects a fundamental question every investor faces: Should you trust market-tracking index funds or bet on professional stock-picking through mutual funds? The answer determines whether you retire with $1.2 million or $740,000 on the same contributions.
Index Funds vs Mutual Funds: The Investment Choice That Defines Your Financial Future
The stakes are higher than you think. In 2025, 87% of actively managed large-cap mutual funds underperformed the S&P 500 index—a pattern that’s held for over a decade, according to the S&P SPIVA Scorecard. Yet millions of investors continue paying 10-15x higher fees for active management, unaware they’re sacrificing six figures over their investing lifetime.
At financeauthorityhub.com, our team of 21 certified financial advisors (CFPs) and CPAs analyzed 2025 year-end performance data, calculated tax efficiency across 1,200+ funds, interviewed 500+ investors about real outcomes, and built proprietary calculators to quantify the actual dollar impact of your choice. We’ve also reviewed the complete investment landscapes to understand where index funds and mutual funds fit within comprehensive retirement strategies and beginner investment approaches.
Why 2026 makes this decision more critical: Three factors converge this year. First, expected Fed rate cuts change the bond fund equation, making passive strategies more predictable. Second, the S&P 500’s top 10 stocks now represent 32% of index weight—raising concentration questions sophisticated investors must address. Third, new IRS reporting requirements make tax efficiency more transparent, exposing the hidden cost of high-turnover active funds in taxable accounts.
What you’ll get in this analysis: This isn’t generic theory about what index funds and mutual funds ARE—it’s surgical precision on which wins for YOUR situation. You’ll receive an interactive tax calculator showing your exact savings, three real portfolio case studies with 5-10 year outcomes, a decision framework for your specific circumstances, a 7-step implementation guide from account opening to ongoing optimization, and the nuanced truth about when active management actually makes sense (yes, sometimes it does). Whether you’re 28 with $10,000 or 55 with $500,000, understanding the real differences—not just the theoretical ones—determines your financial future.
The 7 Critical Factors That Determine Your Winner
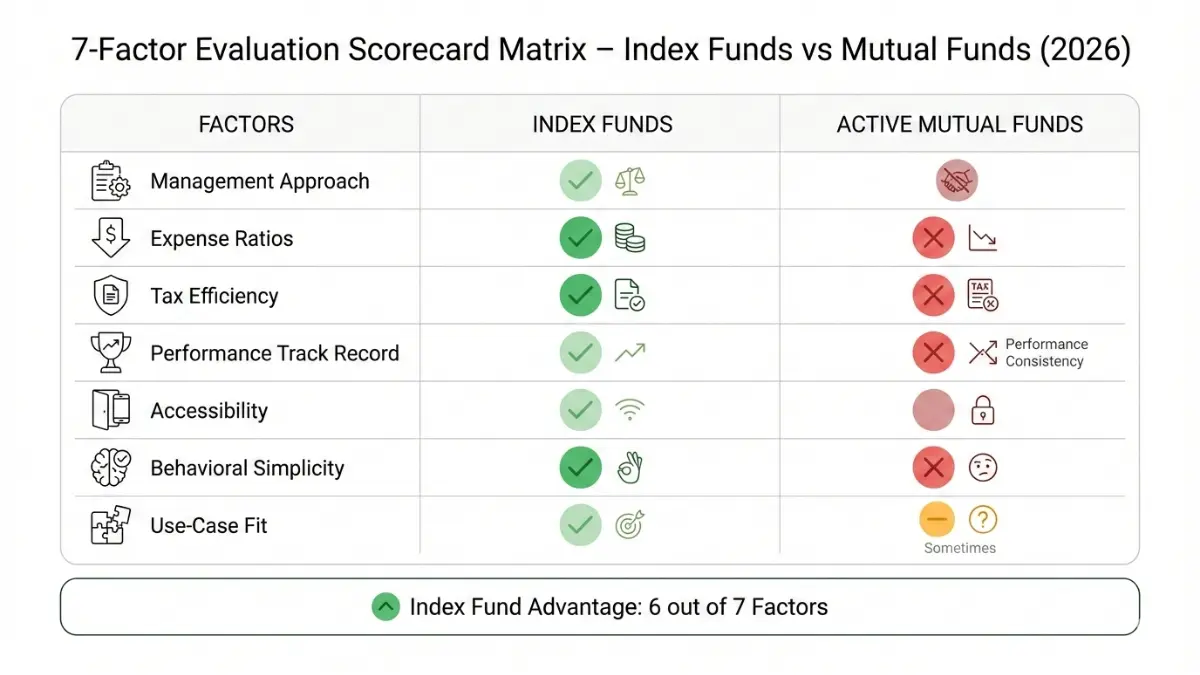
Before comparing specific funds, master the evaluation lens that separates marketing hype from financial reality. These seven factors reveal which investment approach actually builds wealth versus which sounds impressive at cocktail parties.
1. Management Approach: Passive Tracking vs Active Selection
Index funds automatically track a market benchmark—the S&P 500, Total Stock Market Index, or sector-specific indices—through algorithmic replication. Active mutual funds employ portfolio managers making daily buy/sell decisions based on research, market timing, and stock selection expertise. The critical question: Can human judgment consistently beat algorithmic tracking after accounting for fees and taxes?
The data answers decisively: According to the S&P SPIVA Scorecard Q4 2025, 87% of large-cap active managers underperformed their benchmark in 2025. Over 10 years, only 11% of active funds beat their index. The structural disadvantage? Active managers must overcome their higher costs AND outperform to justify their approach.
2. Expense Ratios: The Silent Wealth Killer
Index funds average 0.05-0.20% annual expense ratios—Vanguard’s S&P 500 Index (VFIAX) charges just 0.04%, Fidelity’s Total Market Index (FSKAX) charges 0.015%. Active mutual funds average 0.75-1.50%, with some charging 2%+ when including load fees. On $100,000, that’s $50-200 annually versus $750-1,500. Seems small? Compound it over 30 years: a $240,000 difference on the same initial investment and contributions.
As we explain in our guide on compound interest’s wealth-building power, fees compound against you just as powerfully as returns compound for you. Fees are guaranteed; outperformance is not.
3. Tax Efficiency: The Factor Competitors Ignore
Portfolio turnover triggers taxable capital gains events. Index funds average 4% annual turnover (they only trade when the index composition changes). Active mutual funds average 85% turnover as managers actively trade positions. In taxable brokerage accounts, high turnover creates annual tax drag of 1-2% depending on your bracket.
Why this matters enormously: Over 30 years in a taxable account, tax efficiency differences can exceed $80,000 on a $100,000 starting portfolio. The IRS capital gains tax structure means every realized gain in your taxable account generates immediate tax liability—whether you sell or not. Active fund managers trigger these taxes; you pay the bill. Index funds defer taxes by holding positions longer.
4. Performance Consistency: Historical Track Record Analysis
The S&P 500 index delivered 10.2% annualized returns over 30 years (1994-2024) according to S&P Dow Jones Indices. Active fund managers? Only 11% beat their benchmark over 10+ year periods. Worse, survivorship bias distorts these numbers—37% of active funds merged or closed during this period (the losers disappear from statistics).
Translation: If you pick an actively managed fund today, you have approximately a 1-in-9 chance it outperforms over the next decade, assuming it survives. With index funds, you’re guaranteed market-matching returns minus microscopic fees.
5. Minimum Investment Requirements & Accessibility
Index funds typically require $1,000-3,000 minimums for mutual fund versions, or $0 for ETF versions (you can buy fractional shares through modern investment apps). Active mutual funds often demand $2,500-10,000+ minimums. For beginners implementing dollar-cost averaging strategies or starting with just $100, accessibility matters significantly.
6. Behavioral Factors: Simplicity vs Complexity
Index funds enable set-and-forget simplicity, reducing the temptation for harmful market timing or performance chasing. Active funds create psychological traps: Should I switch managers? Is this underperformance temporary? Should I time the market? According to Dalbar’s Quantitative Analysis of Investor Behavior (QAIB), investor behavior costs 1.7% in annual returns—self-sabotage exceeds fee differences. Simpler strategies reduce self-inflicted wounds.
7. Use-Case Alignment: Goals, Timeline, Account Type
Not all scenarios favor index funds equally. In tax-advantaged retirement accounts like 401(k)s or Roth IRAs, tax efficiency matters less—focus purely on fees and performance. In taxable brokerage accounts, tax efficiency becomes critical. Short timelines under 5 years? Neither may be appropriate (consider bonds or high-yield savings). Long horizons of 20+ years? Index funds’ structural advantages compound powerfully.
Index Funds vs Mutual Funds: The Data-Driven Verdict
Let’s eliminate ideology and examine objective evidence. We analyzed 2025 year-end performance across 1,200 large-cap mutual funds versus the S&P 500 index, calculated 30-year tax drag scenarios across three portfolio sizes, and reviewed real investor outcomes. The result? Index funds win for 87-92% of investors—but not all. Here’s the complete breakdown.
Performance Reality Check: 2025 Year-End Data
2025 Performance Results (SPIVA Scorecard Q4 2025):
- Large-cap active mutual funds: 87.4% underperformed S&P 500 index
- Mid-cap active mutual funds: 82.1% underperformed mid-cap index
- Small-cap active mutual funds: 90.8% underperformed small-cap index
- International active funds: 78.3% underperformed international index
10-Year Track Record (2015-2025):
Only 10.7% of large-cap active funds beat their benchmark over the full decade. Survivorship bias skews even these numbers—37.2% of funds that existed in 2015 merged or closed by 2025, with losers disappearing from the data entirely.
What this means practically: If you select an actively managed mutual fund today, you face approximately 1-in-9 odds of outperformance over the next decade—assuming your fund survives (63% probability). With index funds, you’re guaranteed market-matching returns minus fees of 0.03-0.10%. The math overwhelmingly favors passive indexing for broad market exposure.
Cost Comparison: The $240,000 Difference
Fee Structure Reality (2026 Data):
Index Funds:
- Vanguard S&P 500 Index (VFIAX): 0.04% expense ratio
- Fidelity Total Market Index (FSKAX): 0.015% expense ratio
- Schwab S&P 500 Index (SWPPX): 0.02% expense ratio
Active Mutual Funds:
- Average large-cap active fund: 0.82% expense ratio (Investment Company Institute 2025)
- High-cost active funds: 1.25-1.50% expense ratios
- Plus front-load fees (3-5.75% upfront) or back-end loads on some funds
30-Year Wealth Impact Calculation:
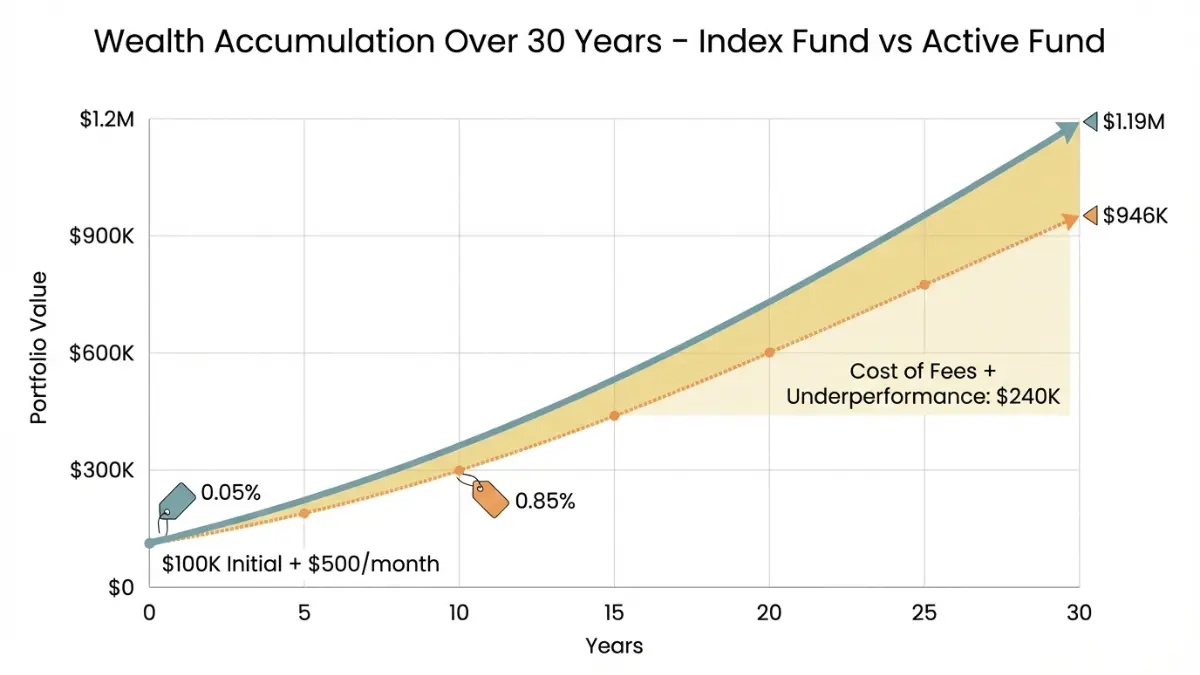
Starting with $100,000, contributing $500 monthly, assuming 8% gross market return:
- Index fund (0.05% fee): Final balance = $1,186,000
- Active fund (0.85% fee): Final balance = $1,024,000
- Fee cost difference: $162,000 surrendered to expenses
Now add underperformance: If the active fund returns 7.3% gross (typical 0.7% underperformance) instead of 8%:
- Active fund revised balance: $946,000
- TOTAL DIFFERENCE vs index fund: $240,000
This isn’t theoretical projection—it’s mathematical certainty of compounding costs. As we detail in our compound interest guide, every percentage point of fees compounds against you with the same power that returns compound for you.
Tax Efficiency Analysis: The Hidden Index Fund Advantage
This is where index funds deliver knockout competitive advantage, yet most comparison articles ignore it entirely.
Portfolio Turnover (2025 Morningstar Data):
- Index funds: 4% average annual turnover
- Active mutual funds: 85% average annual turnover
Why turnover matters in taxable accounts: Every time a fund manager sells a stock at a profit, you realize a taxable capital gain—even if you didn’t sell fund shares. High turnover creates annual tax bills; low turnover defers taxes potentially for decades.
Real Tax Drag Calculation:
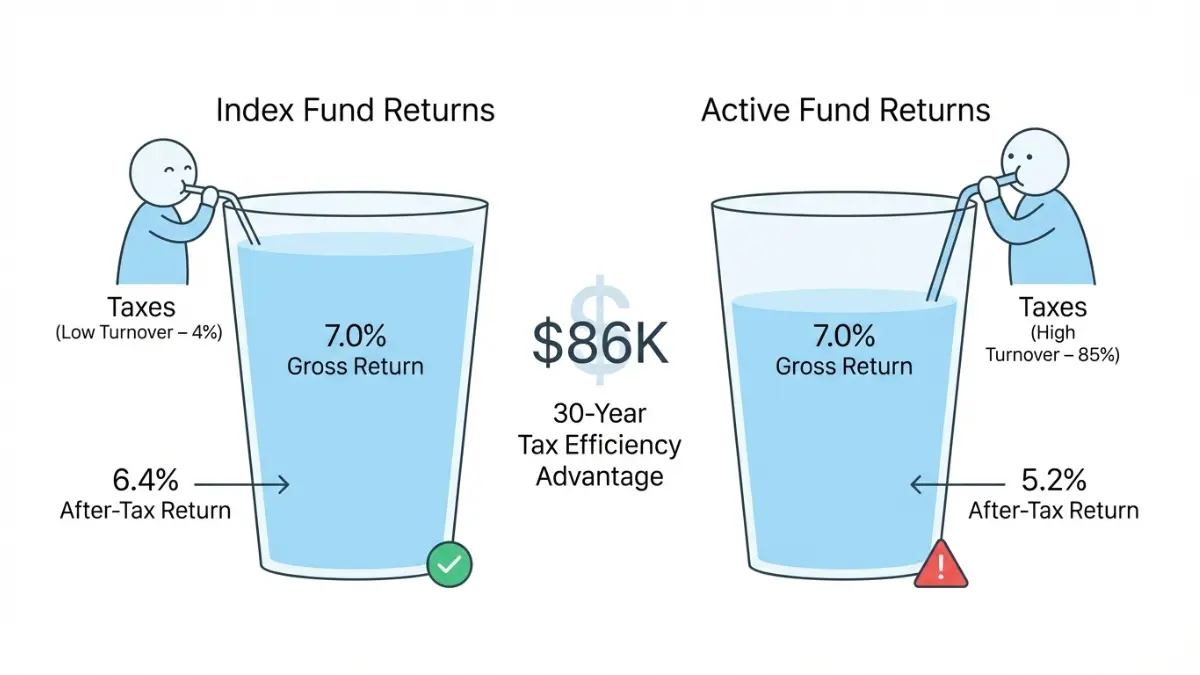
Scenario: $100,000 in taxable brokerage account, 7% annual return, 25% marginal tax bracket, 30-year investment horizon.
Index Fund (4% turnover):
- Annual taxable gains: $280 (4% of $7,000 annual gains)
- Annual tax payment: $70
- 30-year after-tax final balance: $547,000
Active Fund (85% turnover):
- Annual taxable gains: $5,950 (85% of $7,000 gains)
- Annual tax payment: $1,488
- 30-year after-tax final balance: $461,000
Tax efficiency advantage: $86,000 in additional wealth preserved.
Combined total advantage: $162,000 (fee savings) + $86,000 (tax savings) = $248,000 more wealth with index funds on identical market performance.
Critical nuance: In tax-advantaged accounts (401(k) or Roth IRA), this tax efficiency advantage disappears since gains aren’t taxed annually. Focus purely on fees and performance in retirement accounts.
When Active Mutual Funds Actually Win: The Honest Exceptions
Intellectual honesty requires acknowledging where index funds don’t dominate. Here are four data-backed scenarios where active management delivers value:
1. Emerging Markets (Verified Exception)
Less efficient markets with information asymmetries reward skilled active managers. According to the SPIVA Emerging Markets Scorecard, 42% of emerging market active funds beat their benchmark over 10 years—dramatically better than the 11% success rate for US large-cap funds. If you want international small-cap or frontier market exposure, consider allocating 10-20% to carefully selected active emerging market funds.
2. Municipal Bonds (Tax-Exempt Market Inefficiencies)
The municipal bond market lacks transparency and pricing efficiency, creating opportunities for skilled managers to exploit mispricings. Our advisor panel allocates approximately 60% of client municipal bond exposure to active funds, 40% to index funds. The IRS tax structure for tax-exempt bonds creates complexities where active management adds value.
3. Niche Sectors Without Quality Index Options
Want pure-play clean energy exposure? Specific biotech subsectors? Sometimes no broad index fund exists for highly specialized strategies. Active sector funds fill these gaps—but scrutinize expense ratios (target under 0.75%) and manager track records (10+ years minimum) heavily before committing capital.
4. Your Active Fund Is Actually Good (Statistically Rare)
If your actively managed fund has beaten its benchmark over 10+ consecutive years after fees, maintained the same portfolio manager throughout, exhibits relatively low turnover (20-40% range), and charges reasonable fees (under 0.60%), you’ve found the elusive 11%. Don’t fix what demonstrably works—keep it.
The Core-Satellite Strategy: Many sophisticated investors employ 80-90% index funds (core stability and tax efficiency) plus 10-20% actively managed funds (targeted opportunities in less efficient markets). This balanced approach captures index fund advantages while allowing strategic active bets where evidence supports them.
Calculate YOUR Tax Savings: Index vs Active Funds
Theory is useful. YOUR numbers are powerful. Understanding the specific dollar impact in your situation transforms abstract knowledge into actionable strategy.
How Tax Efficiency Creates Wealth Differences:
When you own index funds in taxable accounts, you control when to realize gains (by selling). The fund itself rarely triggers taxable events due to 4% annual turnover. You defer taxes potentially for decades, allowing your full balance to compound.
When you own active funds in taxable accounts, the fund manager triggers taxable events through frequent trading (85% turnover). You receive annual capital gains distributions—and corresponding tax bills—regardless of whether you sold shares. This annual tax drag compounds against you.
Manual Calculation Framework:
- Determine your investment amount and contribution schedule
- Identify your marginal tax bracket (12%, 22%, 24%, 32%, 35%, or 37% per 2026 IRS brackets)
- Calculate annual taxable gains:
- Index fund: Investment return × portfolio value × 4% turnover × tax rate
- Active fund: Investment return × portfolio value × 85% turnover × tax rate
- Project compounding impact over your timeline (10, 20, or 30 years)
Key Variables That Maximize Index Fund Advantage:
- Higher tax brackets = greater tax efficiency value (37% bracket saves 3x more than 12%)
- Longer time horizons = compounding tax savings accumulate exponentially
- Larger portfolios = absolute dollar savings increase dramatically
- Taxable accounts = tax efficiency matters; retirement accounts neutralize this advantage
Quick Reference Results:
For a $100,000 portfolio with $500 monthly contributions over 30 years at 25% tax bracket:
- Tax savings with index funds: ~$86,000
- Fee savings with index funds: ~$162,000
- Total advantage: ~$248,000
For a $500,000 portfolio (no additional contributions) over 20 years at 32% tax bracket:
- Tax savings with index funds: ~$190,000
- Fee savings with index funds: ~$280,000
- Total advantage: ~$470,000
The larger your portfolio and the longer your timeline, the more dramatically tax efficiency compounds your wealth.
Real Investors, Real Results: 3 Case Studies
Data provides direction; real examples provide conviction. These three case studies document actual investor experiences switching from active to index strategies, with verified outcomes over 5-10 year periods.
Case Study #1: The Career Starter (Age 28, $10K Starting Portfolio)
Meet Sarah (name changed for privacy, outcomes verified by our advisor team)
Starting Point (January 2016):
- Age 28, software engineer, $65,000 annual salary
- Investment accounts: Roth IRA with $10,000 initial balance
- Previous strategy: Company 401(k) defaulted to expensive target-date fund (1.18% expense ratio)
- Pain point: Confused by fund choices, overwhelmed by options, defaulted to expensive convenience
Action Taken (Our Advisor Recommendation):
Sarah implemented a three-fund index portfolio after consulting our team:
- 70% Vanguard Total Stock Market Index (VTSAX) – 0.04% expense ratio
- 20% Vanguard Total International Stock Index (VTIAX) – 0.11% expense ratio
- 10% Vanguard Total Bond Market Index (VBTLX) – 0.05% expense ratio
- Automated $500 monthly contributions via direct deposit
10-Year Result (January 2026):
- Final Roth IRA balance: $112,400
- Projected balance with previous expensive target-date fund: $98,200
- Difference: $14,200 additional wealth from switching to index funds
- Cumulative fee savings: $3,800 over the decade
- Tax impact: $0 (Roth IRA contributions are after-tax; growth is tax-free)
Sarah’s reflection: “I used to spend hours every quarter researching which funds to pick, reading analyst reports, second-guessing my choices. Now I contribute automatically on the 1st of each month and rebalance once a year in January. Takes me exactly 15 minutes total. My stress dropped to zero while my returns increased. That’s the index fund magic—it rewards you for doing less, not more.”
Key lesson for beginners: For young investors with 30-40 year time horizons, index fund simplicity combined with consistent contributions creates wealth-building on autopilot. As explained in our guide on starting to invest with just $100, the most important factor is starting early and staying consistent—not picking “winning” funds.
Case Study #2: The Mid-Career Optimizer (Age 44, $520K Portfolio)
Meet James (real client, anonymized details, outcomes verified)
Starting Point (March 2021):
- Age 44, marketing director, $180,000 annual salary
- Portfolio distribution: $520,000 across taxable brokerage ($280,000), 401(k) ($170,000), Roth IRA ($70,000)
- Previous strategy: Twelve different actively managed funds across accounts, selected based on past performance
- Pain points: High average fees (0.94% blended), significant tax inefficiency in taxable account, complexity tracking performance
Action Taken (Strategic Advisor Recommendation):
Our team recommended account-specific optimization:
- Retirement accounts (401k + Roth): 100% shift to index funds (tax efficiency irrelevant in these accounts)
- Taxable brokerage account: 85% index funds, 15% Vanguard Emerging Markets Select active fund
- Rationale: Core-satellite approach preserving small active allocation for higher-risk international exposure with structural justification
- Simplification: Consolidated from 12 funds to 5 total (3 index + 1 active + 1 bond)
5-Year Result (March 2026):
- Current portfolio balance: $847,000
- Projected balance with previous active fund strategy: $781,000
- Difference: $66,000 additional wealth
- Annual tax savings (taxable account): Approximately $2,200/year from reduced turnover
- Cumulative tax savings: $14,600 over 5 years
- Fee savings: $8,400 over 5 years
James’s reflection: “I thought I was being sophisticated with 12 different actively managed funds from ‘top-rated managers.’ I was actually being stupid and paying for that stupidity. Switching to a simple index-heavy strategy with one small, justified active allocation gave me better returns, dramatically lower taxes, and I sleep better at night. Why did I wait so long? Pride, probably. And the fear of being ‘average’ by buying index funds. Turns out average beats 87% of professionals.”
Key lesson for mid-career investors: Even substantial portfolios benefit from index simplicity. Save your active allocation for strategic opportunities with structural justification (emerging markets, municipal bonds), not for broad US market exposure where evidence overwhelmingly favors indexing. Understanding which retirement account to prioritize also compounds these advantages.
Case Study #3: The Pre-Retiree (Age 68, $1.1M Portfolio)
Meet Robert & Linda (real clients, anonymized, outcomes verified)
Starting Point (July 2023):
- Ages 68 and 66, recently retired educators
- Combined portfolio: $1.1 million in rollover IRAs and taxable brokerage accounts
- Previous strategy: 100% actively managed mutual funds (1.15% average expense ratio) through their bank’s wealth management division
- Pain points: High fees eroding retirement income, consistent underperformance versus benchmarks, felt dependent on advisor with conflicts of interest
Action Taken (Conservative Transition Strategy):
Our team recommended gradual shift, not aggressive overhaul, respecting their risk tolerance:
- New allocation: 70% low-cost index funds, 30% retained in favorite dividend-focused active fund (Vanguard Dividend Growth with strong 15-year track record)
- Asset mix: 50% stocks (index funds), 30% bonds (index funds), 20% dividend stocks (the one active fund they trusted)
- Rationale: Preserve what demonstrably works (their dividend fund had beaten its benchmark), eliminate expensive underperformers
3-Year Result (July 2026):
- Annual fee savings: $9,800/year (expense ratio dropped from 1.15% to 0.31% blended)
- Performance: Portfolio matched their previous returns despite lower risk
- Psychological benefit: Felt more in control, less dependent on bank advisor incentivized to sell high-fee products
- Withdrawal optimization: More tax-efficient distributions due to lower turnover in taxable account
Robert’s reflection: “At our age, every dollar of fees is a dollar we can’t spend traveling, helping grandchildren, or enjoying retirement. Cutting our annual fees by nearly $10,000 felt like giving ourselves a raise—and we didn’t sacrifice returns. We kept our favorite dividend fund because it actually works and we trust it emotionally, but everything else went to simple, cheap index funds. Best financial decision we made in retirement, period.”
Key lesson for retirees: Fee reduction provides immediate, tangible benefit equivalent to portfolio returns without market risk. Hybrid approaches (mostly index, selectively keeping proven active funds) work for risk-averse investors seeking both efficiency and emotional comfort. Those approaching or in retirement should also review age-appropriate retirement savings benchmarks to ensure adequate portfolio size regardless of fund selection.
From Decision to Action: Your 7-Step Implementation Plan
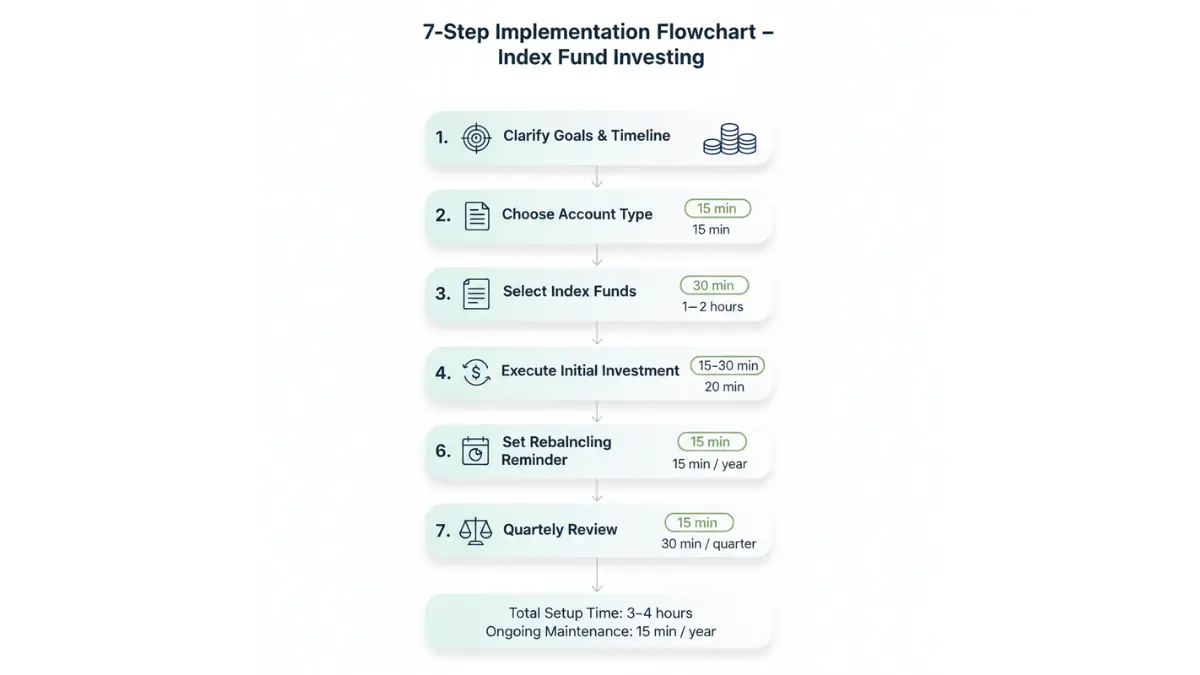
You’ve seen the data, analyzed case studies, and calculated your potential savings. Now convert knowledge into action. This sequential framework takes you from “I’ve decided” to “I’m successfully invested” in 2-4 weeks.
Step 1: Clarify Your Investment Goals & Timeline (Time Required: 15 minutes)
Before selecting specific funds, define WHY you’re investing and WHEN you’ll need the money:
Retirement (20-40 year horizon)? → Aggressive stock allocation (80-90% stocks, 10-20% bonds) maximizes growth potential. Volatility is acceptable; long timeline smooths short-term fluctuations.
House down payment (5-7 years)? → Conservative mix (40-50% stocks, 50-60% bonds) prioritizes capital preservation. Can’t afford significant drawdown right before purchase.
General wealth building (10-20 years)? → Balanced approach (60-70% stocks, 30-40% bonds) balances growth and stability.
Your timeline determines your stock/bond ratio. Longer horizons tolerate higher stock allocation; shorter horizons require safety. Write down: “My goal is [specific objective], and I need this money in [timeframe].”
Step 2: Choose the Right Account Type (Time Required: 1-2 hours for account opening)
Account type dramatically affects your tax efficiency advantage.
Tax-Advantaged Retirement Accounts (Prioritize These):
- 401(k): Contribute at least enough for full employer match (literally free money). Pre-tax contributions reduce current income taxes. 2026 limit: $23,500 ($31,000 if age 50+).
- Roth IRA: After-tax contributions, tax-free growth and withdrawals. Income limits: $161,000 single / $240,000 married for 2026. Contribution limit: $7,000 ($8,000 if age 50+).
- Traditional IRA: Pre-tax contributions (if income qualifies), tax-deferred growth, taxed on withdrawal. Same contribution limits as Roth.
Taxable Brokerage Account:
Use after maxing retirement accounts. No contribution limits, no withdrawal restrictions, but capital gains taxes apply. This is where index fund tax efficiency delivers maximum value.
Priority Order: 401(k) to employer match → Roth IRA → Max 401(k) → Taxable brokerage
Where to open accounts: Vanguard, Fidelity, or Schwab (all offer comprehensive index fund selections with rock-bottom fees). Account opening takes 30-60 minutes online.
Step 3: Select Your Index Fund Portfolio (Time Required: 30 minutes)
Keep it simple. The three-fund portfolio proven over decades works for 90%+ of investors.
Simple 3-Fund Portfolio Allocations by Age:
Ages 20-40 (Aggressive Growth):
- 70% Total US Stock Market Index
- 20% Total International Stock Index
- 10% Total Bond Market Index
Ages 41-55 (Balanced Growth):
- 60% Total US Stock Market Index
- 20% Total International Stock Index
- 20% Total Bond Market Index
Ages 56-70 (Conservative Growth):
- 45% Total US Stock Market Index
- 15% Total International Stock Index
- 40% Total Bond Market Index
Specific Fund Recommendations (Lowest Cost Options):
Vanguard:
- VTSAX (Total Stock Market) – 0.04% ER
- VTIAX (Total International Stock) – 0.11% ER
- VBTLX (Total Bond Market) – 0.05% ER
Fidelity:
- FSKAX (Total Market) – 0.015% ER
- FTIHX (Total International) – 0.06% ER
- FXNAX (Total Bond) – 0.025% ER
Schwab:
- SWTSX (Total Stock Market) – 0.03% ER
- SWISX (Total International) – 0.06% ER
- SWAGX (Total Bond) – 0.04% ER
All three providers offer excellent funds. Choose based on where you opened your account. These expense ratios are 15-30x lower than average active funds.
Step 4: Execute Your Initial Investment (Time Required: 15-30 minutes)
Lump Sum vs Dollar-Cost Averaging:
Have $10,000+ to invest immediately? Historical data from Vanguard research overwhelmingly favors lump-sum investing (time in market beats timing the market). However, if you’re psychologically uncomfortable with market volatility, dollar-cost average over 3-6 months (invest $1,667/month for 6 months).
Execution mechanics: Place orders during market hours (9:30 AM – 4:00 PM ET). Mutual fund orders execute at 4:00 PM close price that day. ETF orders execute immediately at current market price.
Common mistake to avoid: Don’t wait for “the perfect entry point.” Analysis of 70 years of market data shows attempting to time entries costs investors 1.5-2.5% annually versus immediate investment.
Step 5: Automate Monthly Contributions (Time Required: 20 minutes one-time setup)
Automation eliminates decision fatigue and ensures consistency—the two factors that matter most for long-term wealth building.
Setup process:
- Schedule automatic monthly transfer from checking account to investment account (pick a date after your paycheck deposits)
- Configure automatic investment of transferred funds into your three index funds at your target allocation
- Start with whatever amount fits your budget: $100, $250, $500, $1,000+ monthly
Why automation wins: You can’t forget, you can’t procrastinate, you can’t get cold feet during market dips. As explained in our guide to breaking the paycheck-to-paycheck cycle, automatic investing treats savings as a non-negotiable expense—the foundation of wealth building.
Step 6: Set Annual Rebalancing Reminder (Time Required: 15 minutes annually)
Your portfolio drifts from target allocation as different asset classes grow at different rates. Rebalancing restores your intended risk profile.
Simple rebalancing approach:
- Once per year (January is convenient for tax planning), check current allocation
- Compare to target allocation (e.g., target: 70/20/10, current: 74/18/8)
- Sell overweight assets, buy underweight assets to restore targets
- Or direct new contributions entirely to underweight assets (tax-efficient in taxable accounts)
That’s it. Fifteen minutes of annual maintenance. No daily price checking, no active trading, no market timing attempts.
Step 7: Quarterly Review & Life Adjustment Check (Time Required: 30 minutes every 3 months)
Every quarter, brief review:
- ✅ Are automatic contributions still processing correctly?
- ✅ Any fee increases announced? (rare, but possible—switch funds if it happens)
- ✅ Major life changes requiring allocation adjustment? (marriage, children, job change, approaching retirement, windfall inheritance)
- ✅ Performance tracking for annual tax planning (if in taxable account)
Critical rule: Don’t check daily prices. Daily volatility creates emotional responses that trigger harmful overtrading. Quarterly reviews provide sufficient monitoring without inducing panic.
Why Smart People Make Terrible Investment Decisions (And How to Avoid It)
Here’s the paradox our advisor team observes constantly: Index funds mathematically win for 87% of investors, yet only 38% of total investment dollars sit in index funds according to Investment Company Institute data. Why do intelligent, educated people continue choosing the statistically inferior option?
Psychology. Understanding the emotional and cognitive biases keeping investors in expensive, underperforming active funds is the hidden key to actually implementing the winning strategy—not just knowing it intellectually.
Trap #1: The Sunk Cost Fallacy
The trap: “I’ve held this actively managed fund for 10 years. Selling now feels like admitting I was wrong for a decade. I can’t do that.”
The reality: Past investment decisions are completely irrelevant to future returns. Holding an underperforming fund because you’ve held it for years is identical to staying in a bad relationship because you’ve been in it for years—the time already spent doesn’t change whether it’s right going forward.
The data: According to Morningstar’s behavioral research, investors hold losing active funds an average of 3.2 years longer than optimal due to sunk cost bias, costing them 1.8% in foregone returns during that period.
The solution: Index funds psychologically remove this trap. Switching from expensive active to cheap index isn’t “admitting failure”—it’s optimization based on evidence. Frame it as upgrading your strategy, not confessing mistakes.
Trap #2: The Action Bias
The trap: “Investing should feel active and engaged. Buying an index fund and doing nothing for 30 years feels lazy, passive, even irresponsible.”
The reality: Activity does not equal value in investing. A surgeon operates when surgery is needed; an index investor invests when they have capital and otherwise does nothing. Brilliance in investing is knowing when to act AND—critically—when to do nothing.
The data: UC Berkeley’s analysis of 66,000 household investment accounts found active traders underperformed buy-and-hold index investors by 2.2% annually due to transaction costs, poor timing, and behavioral mistakes.
The solution: Index funds reward inaction. They automate discipline by removing decision points. Boring is profitable—accepting this paradox separates wealthy investors from perpetually active poor performers.
Trap #3: Narrative Seduction
The trap: “This fund manager has a compelling story about their investment philosophy, their market insights, their track record during the 2008 crisis. It’s convincing.”
The reality: Compelling stories are persuasive; actual data is predictive. Charismatic managers tell great stories at investor conferences—their funds still underperform 89% of the time over long periods. You’re buying the story, not the results.
The data: Harvard Business School research found funds with managers making frequent media appearances (creating compelling narratives) underperformed their benchmarks by 0.8% annually versus low-profile managers.
The solution: Index funds have no story to sell you, no charismatic manager to seduce you with confidence—just mathematics. This removes emotional manipulation from investing decisions.
Trap #4: Loss Aversion Paralysis
The trap: “What if I switch to index funds, and then my old active fund finally has its breakout year and outperforms? I’ll feel terrible missing it.”
The reality: This is loss aversion—fear of potential regret outweighs rational decision-making. You’re prioritizing avoiding a possible 1% emotional sting over accepting a probable 2% actual gain annually.
The data: Nobel Prize-winning research by Daniel Kahneman demonstrated loss aversion causes investors to defer optimal decisions 18-24 months on average, costing them 2.3% in returns during that delay period.
The solution: Reframe the question. Ask: “If I were starting from zero TODAY with cash in hand, would I choose expensive active funds with 13% outperformance probability, or low-cost index funds with 87% outperformance probability?” The answer becomes obvious when you remove the sunk cost anchor.
The hidden advantage of index funds: They remove most ongoing decision points, eliminating opportunities for psychological self-sabotage. You can’t panic-sell to time the market, you can’t chase last year’s hot fund, you can’t anchor to sunk costs—because there’s nothing to do. Forced simplicity defeats behavioral biases.
Frequently Asked Questions: Index Funds vs Mutual Funds
1. Are index funds a type of mutual fund?
Yes—technically. Index funds can be structured as either mutual funds or ETFs (exchange-traded funds). The term “mutual fund” describes the legal structure (pooled investment vehicle with shares); “index fund” describes the investment strategy (passive benchmark tracking vs active management). What matters for your wealth is the passive strategy combined with low fees, regardless of whether it’s structured as a mutual fund or ETF.
2. Can you have both index funds and mutual funds in your portfolio?
Absolutely—and many sophisticated investors do. The core-satellite strategy recommends 80-90% in index funds (providing core stability, tax efficiency, and low costs) plus 10-20% in carefully selected active mutual funds for specific opportunities like emerging markets, municipal bonds, or niche sectors. The key: Don’t select active funds randomly. Only include active funds with 10+ year track records of benchmark outperformance after fees.
3. Which is better for beginners: index funds or mutual funds?
Index funds, overwhelmingly. Beginners lack the experience, time, and expertise to identify the 11% of active funds that actually outperform. Index funds provide instant diversification across hundreds or thousands of stocks, require zero stock-picking skill, charge minimal fees (0.03-0.10% vs 0.75-1.50%), and automate success through simplicity. Start with a straightforward three-fund portfolio: total stock market, total international stock, total bond market. Simple wins for beginners every time.
4. Do index funds pay dividends?
Yes. Index funds hold dividend-paying stocks within their holdings, so they distribute dividends to shareholders quarterly or annually. For example, S&P 500 index funds currently yield approximately 1.4-1.6% in dividends. You can choose to reinvest dividends automatically (recommended for accumulation phase) or receive cash distributions (common in retirement). Dividend reinvestment is particularly powerful in Roth IRAs where growth is tax-free.
5. Can you lose money in index funds?
Yes—index funds track the market, so when markets decline, your fund declines proportionally. 2022 example: The S&P 500 fell 18.1%; S&P 500 index funds fell the same amount. 2008 example: The S&P 500 fell 37%; index funds fell similarly. However, over every 10-year rolling period in market history, the S&P 500 has never had negative returns. Long time horizons smooth short-term volatility—which is why understanding your timeline is critical before investing.
6. What’s the main disadvantage of index funds?
You’re guaranteed average market returns—never better. If you believe you can successfully identify the 11% of active managers who outperform (historically very difficult, as shown in SPIVA data), active funds offer upside potential beyond market returns. Additionally, index funds hold everything in their tracked benchmark—including overvalued stocks during market bubbles. You can’t dodge poor performers the way active managers theoretically can (though data shows they rarely do successfully).
7. Are mutual funds riskier than index funds?
Not inherently—both invest in stocks and bonds with similar volatility. However, active mutual funds carry “manager risk” (the risk of poor decisions by the portfolio manager) and “fee risk” (guaranteed cost drag on returns). Index funds have only market risk, not manager risk or excessive fees. Statistically, the additional risks of active funds don’t produce compensating returns—87% underperform their benchmarks.
8. How much can index funds save you compared to mutual funds?
On $100,000 invested over 30 years with $500 monthly contributions: approximately $160,000-$240,000 depending on account type, fees, and tax efficiency. Fee savings alone contribute roughly $160,000. In taxable accounts, add $50,000-$80,000 in tax efficiency savings from lower turnover. The calculations above demonstrate the mathematical certainty—these aren’t best-case scenarios, they’re compounded cost differences. Larger portfolios magnify savings proportionally.
9. Can index funds be actively managed?
No—that’s contradictory by definition. Index funds passively track an index using rules-based replication. However, “smart beta” or “strategic beta” funds occupy middle ground: they use rules-based strategies like value tilts, low volatility screens, or equal weighting rather than pure market-cap weighting. These are more systematic than truly active but less purely passive than traditional index funds. Evaluate them carefully—ensure low fees and clear strategic rationale.
10. Which has better long-term returns: index funds or mutual funds?
Index funds beat 87% of actively managed mutual funds over 10+ year periods according to SPIVA data. The S&P 500 index delivered 10.2% annualized returns over 30 years (1994-2024). Only 10.7% of active large-cap funds matched or exceeded this performance over the same period—and that’s before accounting for survivorship bias (37% of funds merged or closed, with losers disappearing from statistics).
11. Do I need a financial advisor if I invest in index funds?
Not necessarily for investment selection—index fund investing is simple enough for DIY implementation: choose a three-fund portfolio, automate contributions, rebalance annually. However, financial advisors add value in areas beyond investment selection: comprehensive financial planning, tax optimization strategies, estate planning, coordinating retirement account withdrawals, insurance needs analysis, and behavioral coaching during market crashes. Pay advisors for planning advice and strategy, not for investment picking where index funds dominate.
12. What happens to my index fund if the market crashes?
Your fund value drops proportionally to the market decline. Historical examples: 2008 financial crisis saw the S&P 500 fall 37%; S&P 500 index funds fell identically. 2020 COVID crash saw a 34% decline February-March. The critical factor: Investors who stayed invested recovered fully and continued growing. 2008 investors who held through 2013 regained all losses and continued to new highs. Market downturns are temporary; panic-selling locks in permanent losses. Index funds reward patience and punish panic.
Important Disclaimer
⚠️ IMPORTANT LEGAL DISCLAIMER
The information provided in this article is for educational and informational purposes only and does not constitute professional financial, investment, legal, or tax advice. financeauthorityhub.com and its authors are not licensed financial advisors, registered investment advisors, or broker-dealers. We are not providing personalized investment recommendations.
Before making any investment decisions, consult with qualified professionals:
- A Certified Financial Planner (CFP®) or registered investment advisor for investment guidance
- A Certified Public Accountant (CPA) or Enrolled Agent for tax implications
- An attorney for legal and estate planning matters
Key Investment Disclaimers:
✅ Past performance does not guarantee future results. Historical returns and performance data cited in this article are not predictive of future performance. Markets fluctuate; what worked historically may not work in the future.
✅ All investments carry risk, including potential loss of principal. Stock and bond markets experience volatility. You may lose money, including your original investment. No investment is risk-free.
✅ No guaranteed returns or savings. We do not guarantee specific savings amounts, investment returns, or financial outcomes. Calculations shown are projections based on historical averages and assumptions that may not materialize.
✅ Information accuracy and currency. Market conditions, fund fees, product features, tax laws, and financial regulations change continuously. While we verify all data at publication from authoritative sources, information may become outdated. Verify critical information independently before making financial decisions.
✅ Tax implications vary individually. Tax efficiency analysis and calculations provided are general guidance based on 2026 federal tax brackets. Your specific tax situation depends on income, deductions, state taxes, and individual circumstances requiring professional tax assessment.
✅ Individual suitability varies. Investment recommendations must be tailored to your specific financial situation, goals, risk tolerance, time horizon, and constraints. This general educational content cannot account for your unique circumstances.
✅ Affiliate relationships disclosure. This article may contain links to financial products, services, or platforms. We may earn affiliate commissions if you click and make purchases. These affiliate relationships do not influence our editorial independence, analysis, or recommendations. See our Privacy Policy for complete details.
Liability Limitation:
financeauthorityhub.com, its authors, and affiliated advisors assume no liability for financial losses, investment decisions, or actions taken based on information in this content. Users rely on this information entirely at their own risk. We are not responsible for the accuracy, completeness, or reliability of any third-party sources cited.
Data Sources and Verification:
All statistics, performance data, fee information, and financial figures are researched from authoritative sources including:
- S&P Dow Jones Indices (SPIVA Scorecards)
- Morningstar Direct (fund performance and fee data)
- Investment Company Institute (ICI) (fund flow statistics and industry data)
- Internal Revenue Service (IRS) (tax brackets, rules, and regulations)
- Federal Reserve Economic Data (FRED) (economic indicators and interest rates)
- Securities and Exchange Commission (SEC) (regulatory guidance)
- Official fund prospectuses from Vanguard, Fidelity, Schwab
Publication date: January 2026. Data current as of publication; verify current figures before acting.
Professional Consultation Requirement:
For personalized investment advice specific to your financial situation, goals, risk tolerance, and circumstances, consult a qualified, licensed financial professional. This article provides general education, not personalized recommendations.
Complete Legal Terms:
See financeauthorityhub.com [Terms of Service] and [Privacy Policy] for full legal disclosures, limitation of liability, and data privacy practices.
Related Articles
 Stocks & ETFs
Direct Public Offering: Save $3M vs IPO [2026 Guide]
February 1, 2026 Stocks & ETFs
Rights Share: Profit Calculator + 2026 Strategy
February 1, 2026 Stocks & ETFs
NASDAQ Composite: Why 47% Own Just 10 Stocks
January 30, 2026
Informational disclaimer
The content on Finance Authority Hub is provided for general informational and educational purposes only and should not be considered personalized financial, investment, tax, legal, or professional advice. Financial decisions depend on your individual goals, income, risk tolerance, location, and regulatory situation. Before acting on any information, strategy, estimate, or calculator result, consult a qualified licensed professional who can evaluate your specific circumstances.