Mortgage Rate Calculator 2026 – Today’s Rates & Payment
Mortgage Rate Calculator
Solve the mortgage rate from a target payment (or calculate payment from a rate), then view an amortization schedule, totals, and an optional APR-with-fees estimate.
Inputs
Tip: “APR (with fees)” is an optional estimate that treats fees as reducing the net cash you receive; APR generally includes fees while the interest rate alone does not. [web:125]
Results
Payment (per period)
—
Frequency: —
Interest rate
Nominal annual (APR-style): —
Effective annual: —
Periodic rate: —
Loan summary
Principal: —
Term: —
Ending balance: —
Totals
Total paid: —
Total interest: —
APR with fees (optional estimate)
Fees: — • Net proceeds: — • APR (with fees): —
This is a simplified APR-style estimate for comparison, because real APR rules can vary by lender and jurisdiction.
Year-by-year totals
| Year | Total payments | Total interest | Total principal | Ending balance |
|---|
Amortization schedule (first 360 rows shown)
| # | Date | Start balance | Payment | Interest | Principal | End balance |
|---|
Download CSV for the full schedule.
Results appear after you click “Calculate.”
In This Article
A mortgage rate calculator tells you exactly what you’ll pay each month — and how much your rate is actually costing you over 30 years. As of March 2026, the average 30-year fixed mortgage rate sits at 6.11–6.35% (Freddie Mac, March 12, 2026). Use the calculator above to find your rate, your payment, or your full amortization schedule — in under 60 seconds.
How to Use This Mortgage Rate Calculator (Step-by-Step)
Most calculator pages drop a tool on you and walk away. Not here. Here’s exactly how to get the most accurate results from every field above.
The Two Modes — Choose the Right One First
This mortgage rate calculator runs in two modes. Picking the wrong one wastes your time.
- Mode 1 — “Find Rate From Payment”: You know what you can afford to pay each month. Enter your loan amount, term, and target payment — the calculator solves for your interest rate. Use this to reverse-engineer what rate you need to qualify for a specific home.
- Mode 2 — “Find Payment From Rate”: You have a quoted rate from a lender. Enter the rate, loan amount, and term — the calculator tells you your exact monthly payment, total interest, and full payoff cost.
Field-by-Field Input Guide
| Field | What to Enter | Why It Matters |
|---|---|---|
| Currency | USD (default for US borrowers) | Formats all results correctly |
| Loan Amount (Principal) | Your total mortgage balance | The base of every calculation |
| Term (Years) | 30 (most common) or 15 | Longer term = lower payment, more interest |
| Payment Frequency | Monthly (standard) | Bi-weekly cuts your payoff by ~4–6 years |
| Interest Rate or Target Payment | Your quoted rate OR budget | Drives the entire output |
| Fees for APR Estimate | Closing costs + lender fees | Reveals your true borrowing cost (see Section 4) |
Reading Your Results — What This Means For You
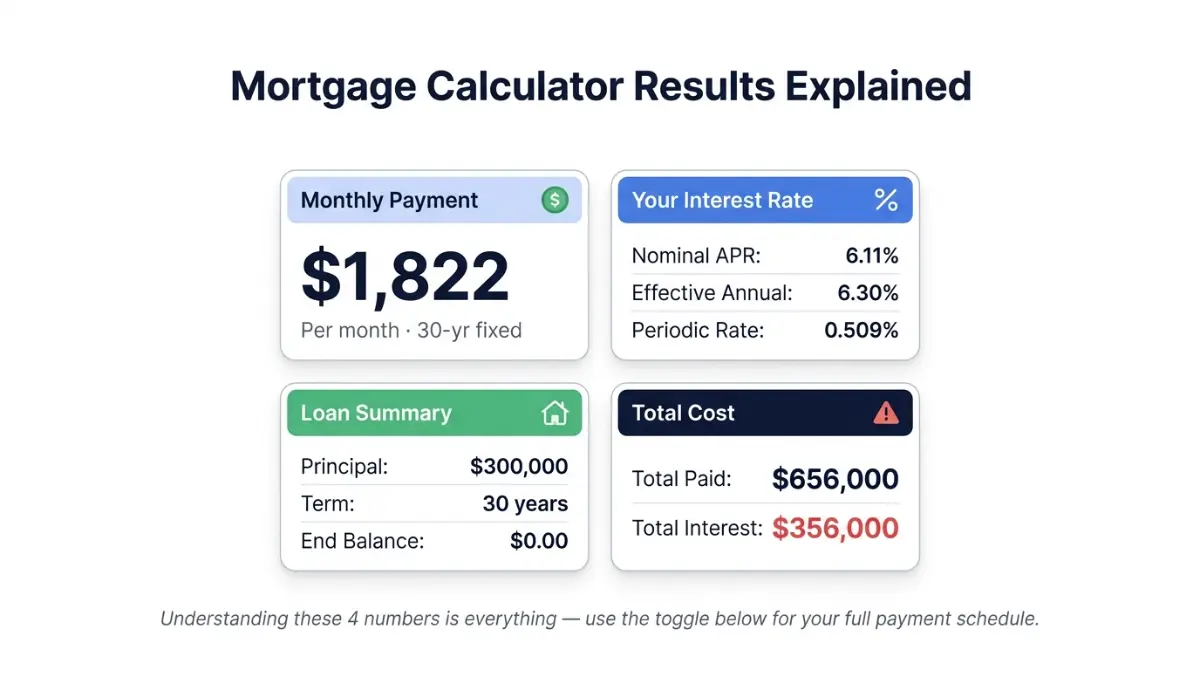
After clicking Calculate, you’ll see four output cards:
- Payment per period — your monthly obligation (principal + interest only, not taxes or insurance)
- Rate breakdown — nominal APR, effective annual rate, and periodic rate
- Loan summary — principal, term, and ending balance (should reach $0)
- Totals — total paid over the loan life and total interest paid
Key insight: The “Total Interest” figure is the most important number on this page. On a $350,000 loan at 6.35% over 30 years, you’ll pay roughly $438,000 in total interest — more than the original loan. That number motivates action.
You can also toggle the full amortization schedule to see every single payment, or download a CSV for your records. Use our amortization calculator for a deeper month-by-month breakdown.
Today’s Mortgage Rates 2026 — What the Numbers Actually Mean
Rates are rising again in March 2026. Here’s where they stand and what the trajectory looks like for the rest of the year.
Current Average Rates by Loan Type (March 2026)
As of March 12, 2026, the 30-year fixed-rate mortgage averaged 6.11% — up from 6.00% the prior week. The 15-year fixed-rate mortgage averaged 5.50%, also up from 5.43%.
| Loan Type | March 2026 Rate | March 2025 Rate | Direction |
|---|---|---|---|
| 30-Year Fixed | 6.11% | 6.65% | ⬇️ Down YoY |
| 15-Year Fixed | 5.50% | 5.80% | ⬇️ Down YoY |
| 5/1 ARM | ~6.46% | ~6.80% | ⬇️ Down YoY |
| 30-Year Refinance | 6.67% | 7.10%+ | ⬇️ Down YoY |
Source: Freddie Mac Primary Mortgage Market Survey, March 2026
Rate Forecast: Will Mortgage Rates Drop Further in 2026?
Bankrate projects the average 30-year rate for 2026 will hover around 6.1%, with a possible range of 5.7% to 6.5% depending on inflation and economic conditions.
The critical variable right now: oil prices. Rising oil prices are fueling a selloff in the bond market, and the market’s perception of risk on 30-year mortgages — plus rising 10-year Treasury yields — are both pushing rates upward.
Bottom line for borrowers:
- Rates are lower than 2024–2025 peaks but rising week-over-week
- The window for 5.X% rates may be limited to borrowers with 760+ credit scores
- If you’re close to buying, locking your rate now is worth serious consideration (see Section 5)
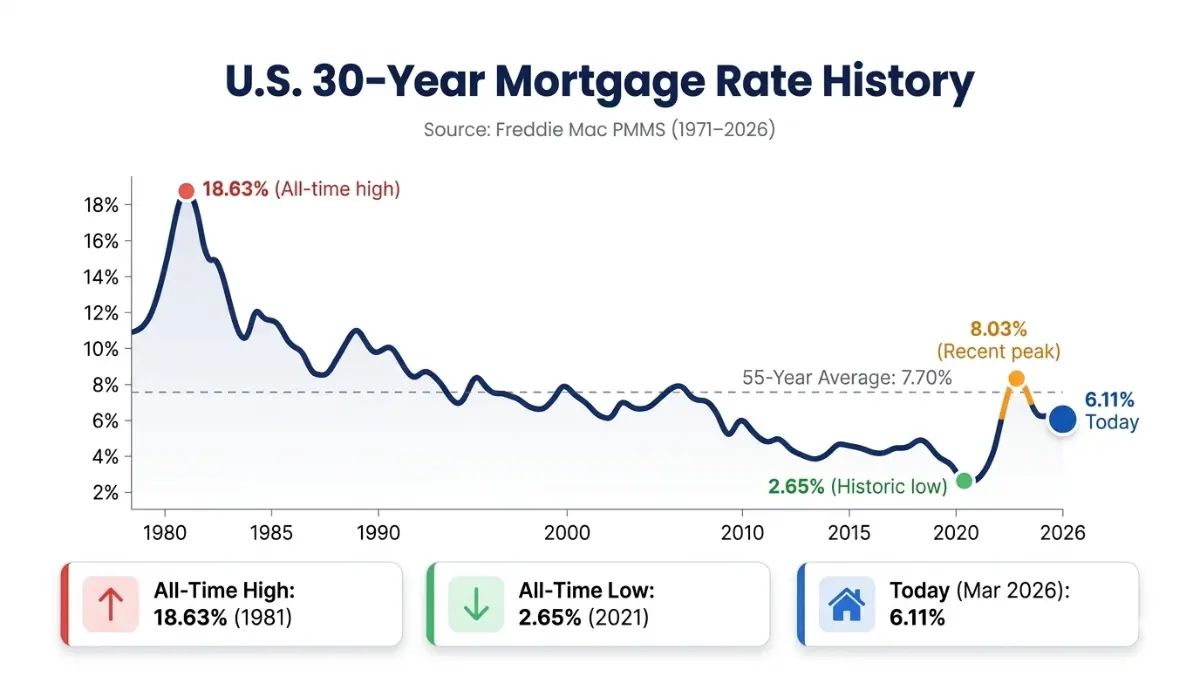
The Historical Context Nobody Shows You
Between April 1971 and February 2026, 30-year fixed-rate mortgages averaged 7.70%. Today’s 6.11% is below the 55-year average. Borrowers conditioned by the 2020–2021 sub-3% era feel today’s rates are painful — but historically, they’re not extreme.
| Year | Avg 30-Yr Rate | Context |
|---|---|---|
| 2021 | 2.65% | COVID-era historic low |
| 2023 | 8.03% | 23-year peak |
| 2025 | ~6.60% | Gradual decline |
| Mar 2026 | 6.11% | Below 55-year average |
For a detailed look at how rates affect your buying power by state, see our guide to the lowest mortgage rates by state in 2026.
Real Payment Scenarios — What $300K Looks Like at Today’s Rates
Stop guessing. Here are exact monthly payments at today’s 2026 rates across common loan amounts.
Monthly Payment Table (Principal + Interest Only)
| Loan Amount | 5.50% (15-yr) | 6.11% (30-yr) | 6.50% (30-yr) | 7.00% (30-yr) |
|---|---|---|---|---|
| $200,000 | $1,634 | $1,215 | $1,264 | $1,331 |
| $300,000 | $2,451 | $1,822 | $1,896 | $1,996 |
| $400,000 | $3,268 | $2,430 | $2,528 | $2,661 |
| $500,000 | $4,085 | $3,037 | $3,160 | $3,327 |
Calculated using standard amortization formula. Does not include property tax, PMI, or homeowners insurance.
Run your exact numbers using our mortgage calculator or check what you can realistically borrow with the home affordability calculator.
The $1,000 Rate Penalty — How a 1% Rate Hike Destroys Wealth
This is the number nobody shows you on a calculator page.
On a $350,000 loan over 30 years:
- At 6.0% → Total interest paid: $403,000
- At 7.0% → Total interest paid: $487,000
- Difference: $84,000 — nearly a quarter of the original loan, lost to a single percentage point
That’s not a hypothetical. That’s the real cost of not shopping lenders, not improving your credit score, and not timing your rate lock.
30-Year vs 15-Year: The Full Cost Showdown
| Factor | 30-Year @ 6.11% | 15-Year @ 5.50% | Winner |
|---|---|---|---|
| Monthly payment ($300K) | $1,822 | $2,451 | 30-yr (lower) |
| Total interest paid | $356,000 | $141,000 | 15-yr (saves $215K) |
| Payoff timeline | 2056 | 2041 | 15-yr (15 years faster) |
| Flexibility | High | Low | 30-yr |
For a full side-by-side breakdown, read our 15 vs 30-year mortgage comparison guide.
Mortgage APR vs. Interest Rate — The $40,000 Mistake Most Borrowers Make
This is the most misunderstood concept in home financing — and every major competitor ignores it on their calculator pages. Here’s what Bankrate and NerdWallet don’t explain.
What Is APR on a Mortgage?
Interest rate = the cost of borrowing the principal. It determines your monthly payment.
APR (Annual Percentage Rate) = the interest rate plus lender fees, points, and certain closing costs, expressed as a yearly rate. It reflects your true borrowing cost.
The Consumer Financial Protection Bureau (CFPB) requires lenders to disclose APR precisely because interest rate alone is misleading.
Interest Rate vs. APR: Side-by-Side
| Factor | Interest Rate | APR |
|---|---|---|
| Includes lender fees? | ❌ No | ✅ Yes |
| Used to calculate payment? | ✅ Yes | ❌ No |
| Best for comparing lenders? | ❌ No | ✅ Yes |
| Shown on Loan Estimate? | ✅ Yes | ✅ Yes |
| Always higher than the other? | N/A | ✅ Almost always |
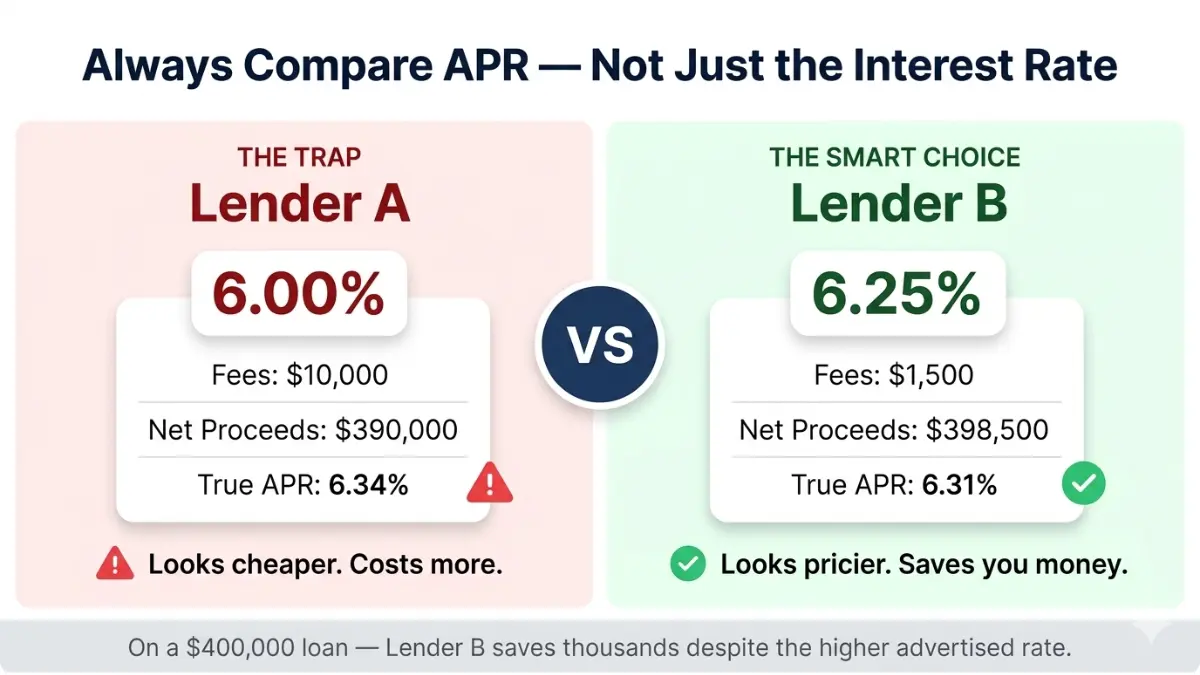
The Real Dollar Example
Say Lender A offers 6.0% rate with $10,000 in fees on a $400,000 loan. Lender B offers 6.25% rate with $1,500 in fees.
- Lender A’s APR: approximately 6.34%
- Lender B’s APR: approximately 6.31%
Lender B is actually cheaper — even though their advertised rate is higher. This is the trap that costs borrowers tens of thousands of dollars.
Our mortgage rate calculator includes a built-in “APR with Fees” estimator: enter your closing costs or fee percentage in the Fees field, and it recalculates your true APR automatically. No other free calculator page explains how to use this feature.
For a deeper breakdown of this topic, read our full APR vs. Interest Rate guide — it covers every fee type that inflates your APR and how to negotiate them down.
Want to calculate your APR across different loan scenarios? Use our dedicated APR calculator.
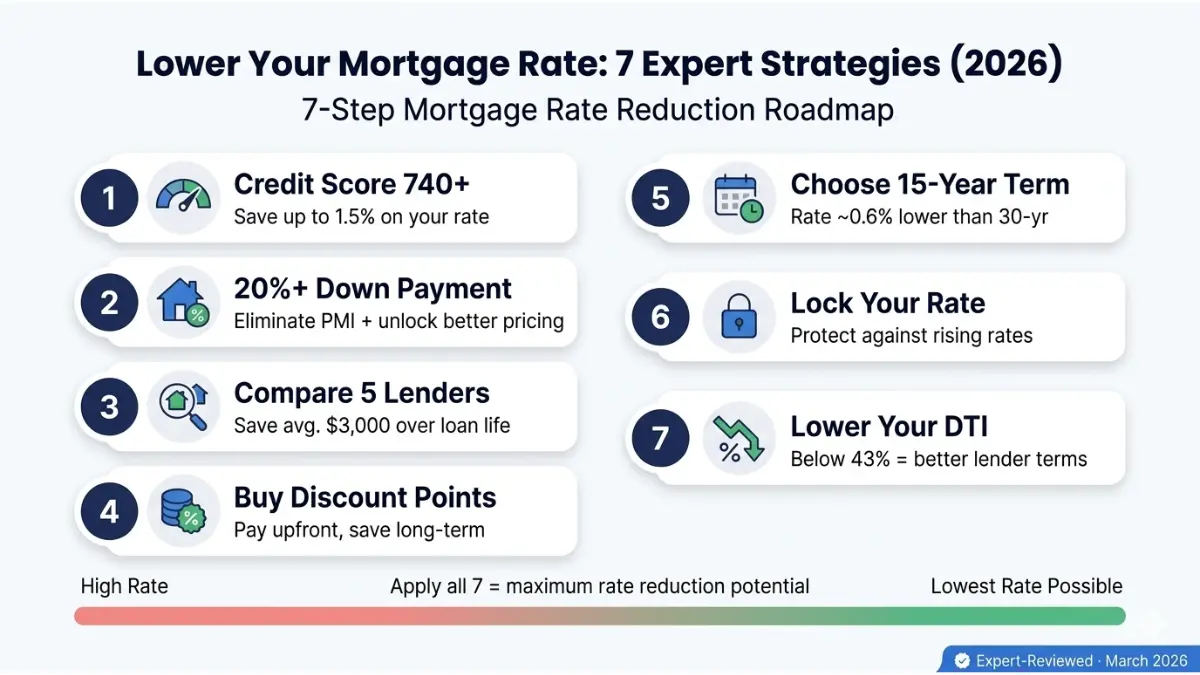
7 Proven Ways to Get a Lower Mortgage Rate in 2026
Your mortgage rate is not fixed by the market. It’s negotiated — and most borrowers leave money on the table. Here’s what actually moves your rate.
Strategy Impact Table
| Strategy | Potential Rate Reduction | Difficulty |
|---|---|---|
| Raise credit score 620 → 760+ | 0.5% – 1.5% | Medium |
| Increase down payment to 20%+ | 0.25% – 0.5% | Hard |
| Compare 3–5 lenders | 0.25% – 0.75% | Easy |
| Buy discount points | 0.25% per point | Paid upfront |
| Choose 15-year term | 0.5% – 0.75% | Medium |
| Lock rate at the right time | Variable | Strategic |
| Lower DTI below 43% | 0.25% – 0.5% | Medium |
1. Boost Your Credit Score Above 740
A 620 credit score versus a 760+ score can mean a rate difference of 0.5% to 1.5% on the same loan. On a $350,000 loan over 30 years, that gap costs over $70,000 in extra interest. Check your score and dispute errors before applying. The CFPB’s guide to mortgage credit scores explains exactly how lenders use your score in pricing.
Use our credit score calculator to model how score improvements affect your financial profile.
2. Increase Your Down Payment to 20%+
Less than 20% down triggers PMI (Private Mortgage Insurance) — adding $100–$400/month to your payment. It also signals higher lender risk, pushing your rate up. Saving to 20% before buying is one of the highest-ROI financial moves available.
Use our down payment calculator to map out a savings timeline. If you need help getting there, read our down payment help guide.
3. Compare At Least 3–5 Lenders
Research by Freddie Mac shows that getting just one additional quote saves borrowers an average of $1,500 over the loan life. Getting five quotes saves an average of $3,000. Most buyers get exactly one quote. Don’t be most buyers.
4. Consider Buying Discount Points
One discount point = 1% of your loan amount, paid upfront, to permanently reduce your rate by approximately 0.25%. On a $400,000 loan, one point costs $4,000 and reduces a 6.5% rate to 6.25%. Break-even: roughly 5–7 years. If you’re staying long-term, points are worth it.
5. Choose a Shorter Loan Term
15-year mortgage rates are consistently 0.5–0.75% lower than 30-year rates. The trade-off is a higher monthly payment. But the interest savings are dramatic — see the comparison table in Section 3.
6. Lock Your Rate Strategically
With rates volatile in March 2026 due to oil price pressure and geopolitical uncertainty, a rate lock protects you from upward movements. Standard locks cover 45–60 days. Ask your lender about “float-down” options — they let you capture a lower rate if the market drops during your lock period.
If you’re considering refinancing an existing mortgage, use our mortgage refinance calculator to model whether a refi makes sense at today’s rates. Also read our refi rates guide for timing strategy.
7. Lower Your Debt-to-Income Ratio Below 43%
Most conventional lenders require a DTI (monthly debt payments ÷ gross monthly income) below 43%. A lower DTI signals lower risk and unlocks better pricing. Pay down credit cards, auto loans, or student loans before applying. Use our debt-to-income ratio calculator to find your exact DTI before you apply.
Frequently Asked Questions — Mortgage Rate Calculator 2026
1. What is a good mortgage rate in 2026?
As of March 14, 2026, the national average 30-year fixed mortgage APR is 6.35% and the 15-year fixed APR is 5.72%. A “good” rate means anything below the national average for your loan type. Borrowers with 760+ credit scores and 20%+ down payments regularly qualify for rates 0.5%–1.0% below the average.
2. How often do mortgage rates change?
Mortgage rates change daily — sometimes multiple times per day. They track the yield on the 10-year U.S. Treasury note and shift with economic data releases, Fed statements, and geopolitical events. Always check rates on the day you’re ready to lock, not weeks prior.
3. What’s the difference between fixed and adjustable mortgage rates?
A fixed-rate mortgage locks your interest rate for the entire loan term — your payment never changes. An adjustable-rate mortgage (ARM) starts lower but can increase after an initial fixed period (e.g., 5/1 ARM = fixed for 5 years, then adjusts annually). ARMs carry more risk in a rising rate environment.
4. How does my credit score affect my mortgage rate?
Your credit score is one of the single biggest factors in your rate pricing. A score of 760+ typically earns the best available rates. A score below 680 can add 1.0%–1.5% to your rate — translating to tens of thousands of dollars over the life of your loan.
5. What is an amortization schedule and how do I read it?
An amortization schedule shows every payment over your loan term — broken into principal and interest. Early payments are mostly interest. Later payments are mostly principal. Use the “Toggle Amortization Schedule” button in the calculator above, or our dedicated amortization calculator for full details.
6. Is it better to choose a 15-year or 30-year mortgage?
Choose a 30-year if you need lower monthly payments and flexibility. Choose a 15-year if you can afford higher payments — you’ll pay roughly 55–60% less total interest and own your home 15 years sooner. Read our full 15 vs 30-year mortgage comparison for a complete analysis.
7. What fees are included in the mortgage APR?
APR includes: origination fees, discount points, mortgage broker fees, and certain closing costs. It does NOT include property taxes, homeowner’s insurance, or title insurance. Always compare lenders using APR — not just the interest rate.
8. How accurate is this mortgage rate calculator?
This calculator uses standard amortization formulas consistent with those used by major U.S. lenders. Results are accurate for fixed-rate loans. Note that your actual payment will also include property taxes, insurance, and potentially PMI — items not factored into a basic principal-and-interest calculation.
9. Should I lock my mortgage rate now or wait in 2026?
With rates rising week-over-week in March 2026 due to oil price pressure and bond market volatility, locking sooner is safer for most buyers. If you’re within 45–60 days of closing, lock now. If you’re 6+ months out, monitor trends and consider a float-down option when you’re ready.
10. Can I use this calculator for mortgage refinancing?
Yes — enter your current remaining loan balance as the principal, your desired new rate or target payment, and your new term. For a complete refinance analysis including break-even point and savings over time, use our dedicated refinance calculator.
11. How do bi-weekly payments save money compared to monthly?
By paying half your monthly payment every two weeks, you make 26 half-payments per year — equivalent to 13 full monthly payments instead of 12. That extra payment per year reduces a 30-year mortgage term by approximately 4–6 years and saves tens of thousands in interest. Switch to bi-weekly in the Payment Frequency field above to see the exact impact on your loan.
📋 Disclaimer: This mortgage rate calculator and all content on this page are provided for educational and informational purposes only and do not constitute financial, legal, or mortgage advice. Rate calculations are estimates based on standard amortization formulas. Actual loan terms, rates, and payments will vary based on your individual credit profile, lender policies, loan type, property location, and current market conditions. Always consult a licensed mortgage professional or financial advisor before making any borrowing decisions. FinanceAuthorityHub.com is not a lender and does not issue mortgage pre-approvals or loan commitments.
Informational disclaimer
The content on Finance Authority Hub is provided for general informational and educational purposes only and should not be considered personalized financial, investment, tax, legal, or professional advice. Financial decisions depend on your individual goals, income, risk tolerance, location, and regulatory situation. Before acting on any information, strategy, estimate, or calculator result, consult a qualified licensed professional who can evaluate your specific circumstances.