Stock Calculator: Profit, ROI & Tax (Free 2026)
Stock Calculator
Calculate profit/loss, total return (including dividends), break-even price, optional taxes, scenarios, and detailed buy-lot + split tables.
Inputs
Total return typically includes both price change and dividends/income. [web:134][web:141]
P/L uses average cost (simple). Tax lots (FIFO/LIFO) can differ by broker/jurisdiction.
A split increases share count and reduces price proportionally; value stays the same. [web:140]
Results
Total cost basis (buys + buy fees)
—
Split-adjusted shares: —
Average cost per share (split-adjusted)
—
Combined split factor: —
Sell proceeds (after sell fee)
—
Dividends (cash): —
Profit / Loss
—
ROI: —
Performance metrics
Total return: — • CAGR (annualized): —
CAGR uses the common formula: (End ÷ Begin)^(1/years) − 1. [web:139]
Break-even & taxes (optional)
Break-even sell price (incl. sell fee, incl. dividends): —
Capital gains tax: — • Dividend tax: —
After-tax P/L: — • After-tax ROI: —
Buy lots detail
| # | Date | Shares | Buy price | Fee | Total cost |
|---|
Stock split events
| # | Date | Ratio | Note |
|---|
Sell-price scenarios (same shares sold + same dividends)
| Scenario | Sell price | Proceeds | P/L | ROI |
|---|
Results appear after you click “Calculate.”
In This Article
Use this free stock calculator to instantly calculate your stock profit or loss, return on investment (ROI), CAGR, break-even price, dividends, capital gains tax, and after-tax returns — all in one place. No signup required.
Whether you just sold shares or are planning your next trade, this stock profit calculator gives you the complete financial picture in seconds — something no competitor’s basic tool can match.
What This Calculator Covers
- ✅ Stock profit and loss — gross and net, including all fees
- ✅ Return on investment (ROI) — as a percentage of your total cost
- ✅ CAGR — annualized return for multi-year holdings
- ✅ Break-even sell price — the exact price you need to avoid a loss
- ✅ Dividend income — total return including cash dividends received
- ✅ Capital gains tax — optional short-term and long-term tax estimates
- ✅ Stock splits — automatically adjusts your cost basis and share count
- ✅ DCA (multiple buy lots) — supports dollar-cost averaging entries
- ✅ Sell-price scenarios — see your P/L if the stock moves ±10%, +25%, +50%
In 2026, knowing your real after-tax return — not just your gross profit — is the difference between a smart exit and a costly mistake.
How to Use This Free Stock Calculator
Step-by-Step: Enter Your Trade Details
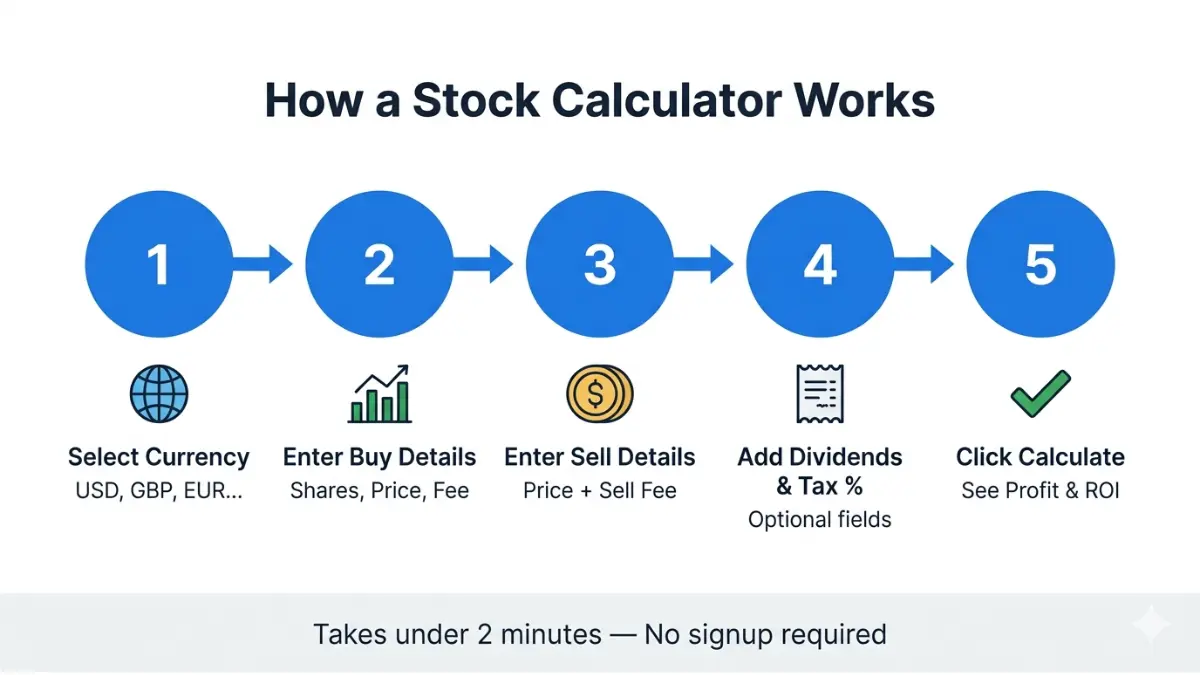
Using this stock return calculator takes under two minutes. Follow these five steps:
- Select your currency — USD, GBP, EUR, CAD, AUD, and 18 more options
- Enter your buy lot(s) — date, number of shares, buy price per share, and any brokerage fee
- Enter your sell details — sell price per share, sell fee, and shares sold (leave blank to sell all)
- Add optional data — dividends received, capital gains tax rate, dividend tax rate, holding dates for CAGR
- Click “Calculate” — your full stock profit analysis appears instantly below
Pro tip: If you used dollar-cost averaging (DCA), click “Add buy lot” to enter each purchase separately. The stock calculator will automatically average your cost basis across all lots.
Understanding Your Results
| Result Label | What It Means | Why It Matters |
|---|---|---|
| Total Cost Basis | Total amount you invested (shares × price + fees) | Your true starting point for all calculations |
| Proceeds | What you received from the sale (shares × sell price − sell fee) | Your gross cash in hand |
| Profit / Loss | Proceeds + dividends − cost basis | Your actual gain or loss |
| ROI | Net profit ÷ cost basis × 100 | Compares this trade to any other investment |
| Total Return % | Includes price change AND dividends | The complete measure of investment performance |
| CAGR | Annualized compounded return | Lets you compare multi-year stock returns fairly |
| Break-Even Price | Min sell price to recover your full cost | Critical decision-making metric before you sell |
| After-Tax P/L | Profit remaining after capital gains + dividend tax | Your real take-home profit |
Stock Splits & DCA (Multiple Buy Lots)
If the stock you own has split since you bought it, this matters for your cost basis calculation.
Example: You bought 10 shares of NVDA at $500. The stock splits 10-for-1. You now hold 100 shares with an average cost of $50 per share — your total invested amount is still $5,000. Enter the split ratio (10-for-1 = numerator: 10, denominator: 1) and the calculator adjusts automatically.
For DCA investors, simply click “Add buy lot” for each purchase:
- Lot 1: 20 shares at $100 on Jan 1
- Lot 2: 20 shares at $80 on Mar 1
- Average cost: $90/share across 40 shares
To understand how consistent investing amplifies returns over time, explore our Compound Interest Calculator and Investment Calculator for long-term projections.
How to Calculate Stock Profit, ROI, and CAGR
Most stock calculator pages stop at a basic profit formula. Here is the complete framework — with real numbers — that serious investors actually use.
Stock Profit and Loss Formula
The foundational stock profit calculation:
P/L = (Sell Price × Shares Sold) − Sell Fee + Dividends − (Buy Price × Shares) − Buy Fee
Real Example:
- Bought 100 shares at $50 → Total cost: $5,000 + $7 commission = $5,007
- Sold 100 shares at $65 → Proceeds: $6,500 − $7 commission = $6,493
- Dividends received: $120
- Net Profit = $6,493 + $120 − $5,007 = $1,606
| Without Fees & Dividends | With Fees & Dividends | |
|---|---|---|
| Gross Profit | $1,500 | $1,606 |
| ROI | 30.0% | 32.1% |
This difference illustrates why using a proper stock investment calculator — not mental math — is essential.
How to Calculate ROI on Stocks
ROI Formula:
ROI = (Net Profit ÷ Total Cost Basis) × 100
Using the example above:
ROI = ($1,606 ÷ $5,007) × 100 = 32.1%
What This Means For You: A 32.1% ROI sounds excellent — but ROI alone doesn’t tell you how long it took. That’s where CAGR becomes essential. The SEC’s Investor.gov reminds investors that fees, holding time, and dividends all affect true investment performance.
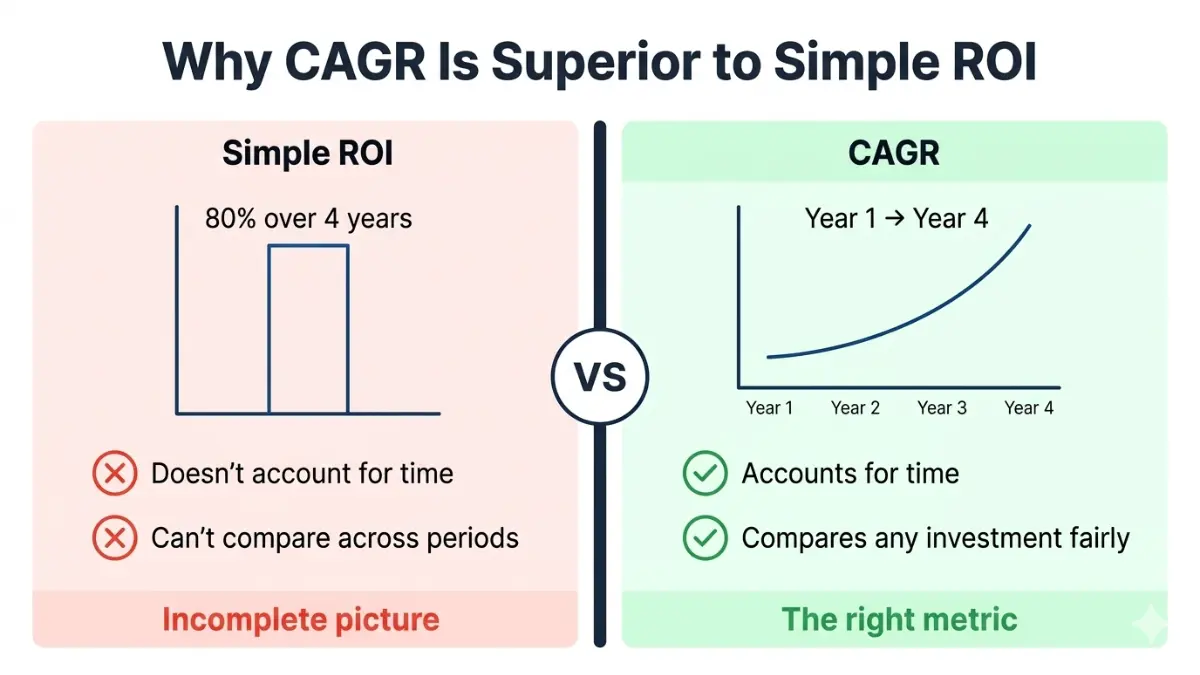
What Is CAGR and Why It Beats Simple ROI
CAGR (Compound Annual Growth Rate) is the most accurate metric for comparing stock returns across different holding periods.
CAGR Formula:
CAGR = (End Value ÷ Start Value)^(1 ÷ Years) − 1
Real Example:
- Invested $5,000 → Value after 4 years: $9,000 (including dividends)
- CAGR = ($9,000 ÷ $5,000)^(1/4) − 1 = 15.8% per year
| Metric | Value | What It Tells You |
|---|---|---|
| Simple Total Return | 80% | Total gain over entire holding period |
| CAGR | 15.8%/year | Annual compounding rate — the right comparison |
| S&P 500 Avg CAGR (long-term) | ~10%/year | Your benchmark |
Key Insight: A trade showing 80% total return over 4 years looks impressive. But at 15.8% CAGR, it just beat the market average. A 30% total return in 1 year (30% CAGR) actually outperforms it.
Zero competitors explain this distinction. This is exactly why investors misread their own performance.
Break-Even Stock Price — What It Is and How to Use It
Break-Even Formula:
Break-Even Price = (Total Cost Basis − Dividends + Sell Fee) ÷ Shares Sold
Real Example:
- Cost basis: $5,007 | Sell fee: $7 | Dividends: $120 | Shares: 100
- Break-even = ($5,007 − $120 + $7) ÷ 100 = $48.94/share
What This Means For You: If the stock is trading above $48.94, any sale generates a profit. Below that level, you’re taking a loss. Knowing your break-even price removes emotion from sell decisions — one of the most powerful tools in disciplined investing.
For retirement-focused investors, pair this analysis with our 401(k) Calculator and Retirement Calculator to see how stock gains fit your long-term goals.
Capital Gains Tax on Stocks — 2026 Complete Guide
This is the section your competitors don’t have. Understanding capital gains tax is the difference between calculating your profit and knowing your actual take-home money.
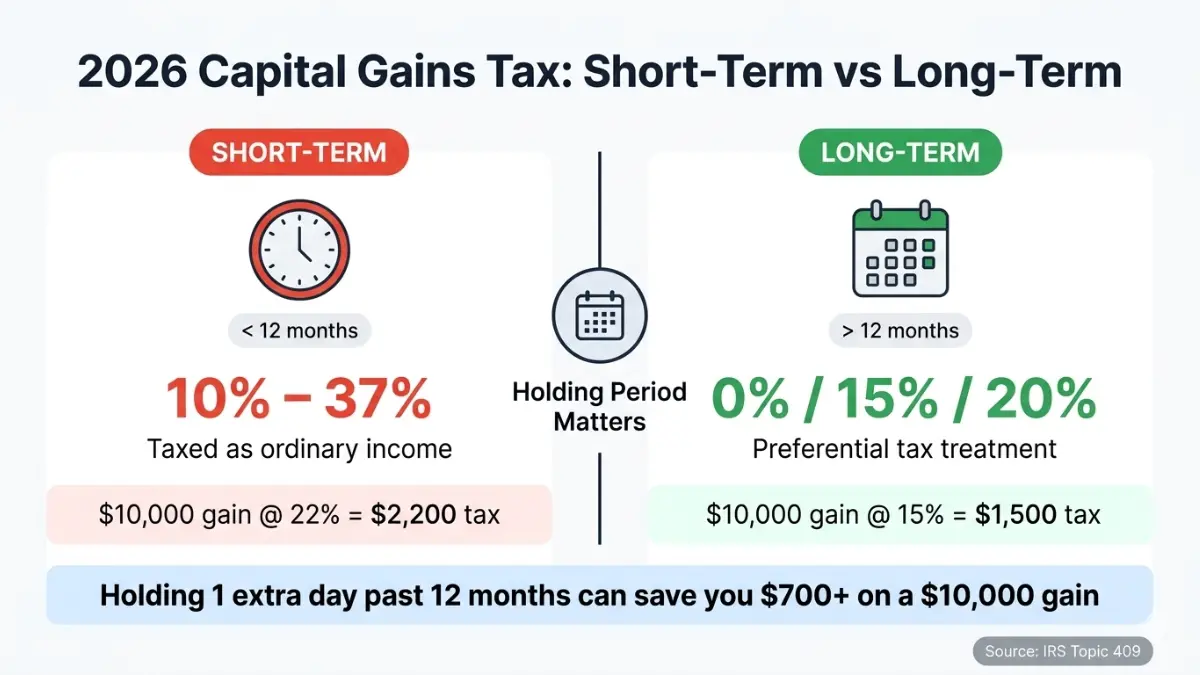
Short-Term vs. Long-Term Capital Gains Tax (2026)
The IRS defines two categories based on your holding period:
- Short-term gain — Stock held ≤ 1 year → Taxed as ordinary income (10%–37%)
- Long-term gain — Stock held > 1 year → Taxed at preferential rates (0%, 15%, or 20%)
2026 Long-Term Capital Gains Tax Brackets (Federal):
| Filing Status | 0% Rate | 15% Rate | 20% Rate |
|---|---|---|---|
| Single | Up to $48,350 | $48,351–$533,400 | Over $533,400 |
| Married Filing Jointly | Up to $96,700 | $96,701–$600,050 | Over $600,050 |
| Head of Household | Up to $64,750 | $64,751–$566,700 | Over $566,700 |
Source: IRS Topic 409 — Capital Gains and Losses
How to Calculate Capital Gains Tax on a Stock Sale
Real Example — Long-Term Gain:
- Net profit from stock sale: $10,000
- Filing status: Single | Taxable income: $55,000
- Rate: 15% (income falls in 15% bracket)
- Capital gains tax owed: $1,500
- After-tax profit: $8,500
| Scenario | Gain | Tax Rate | Tax Owed | After-Tax Profit |
|---|---|---|---|---|
| Short-term (income: $55K) | $10,000 | 22% | $2,200 | $7,800 |
| Long-term (income: $55K) | $10,000 | 15% | $1,500 | $8,500 |
| Long-term (income: $45K) | $10,000 | 0% | $0 | $10,000 |
The difference between short-term and long-term tax treatment on a $10,000 gain can be $2,200 — simply by holding shares one additional day past 12 months.
For a deeper dive, read our complete Capital Gains Tax 2026 guide covering strategies that can save you up to $12,000.
How to Reduce Capital Gains Tax on Stocks (Legal Strategies)
- Hold for 12+ months — Qualify for the significantly lower long-term rate
- Use tax-loss harvesting — Offset profitable sales with losing positions in the same tax year
- Invest through a Roth IRA — Growth and qualified withdrawals are completely tax-free (see our Roth IRA Calculator)
- Max your 401(k) — Tax-deferred growth delays your tax burden (explore our 401(k) vs IRA comparison)
- Spread large sales across tax years — Avoid pushing yourself into a higher bracket
The IRS’s Publication 550 on Investment Income and Expenses covers all deductible investment costs that can reduce your taxable gain.
7 Stock Profit Calculation Mistakes That Cost Investors Money
Most retail investors make at least two of these errors. Each one distorts your true return.
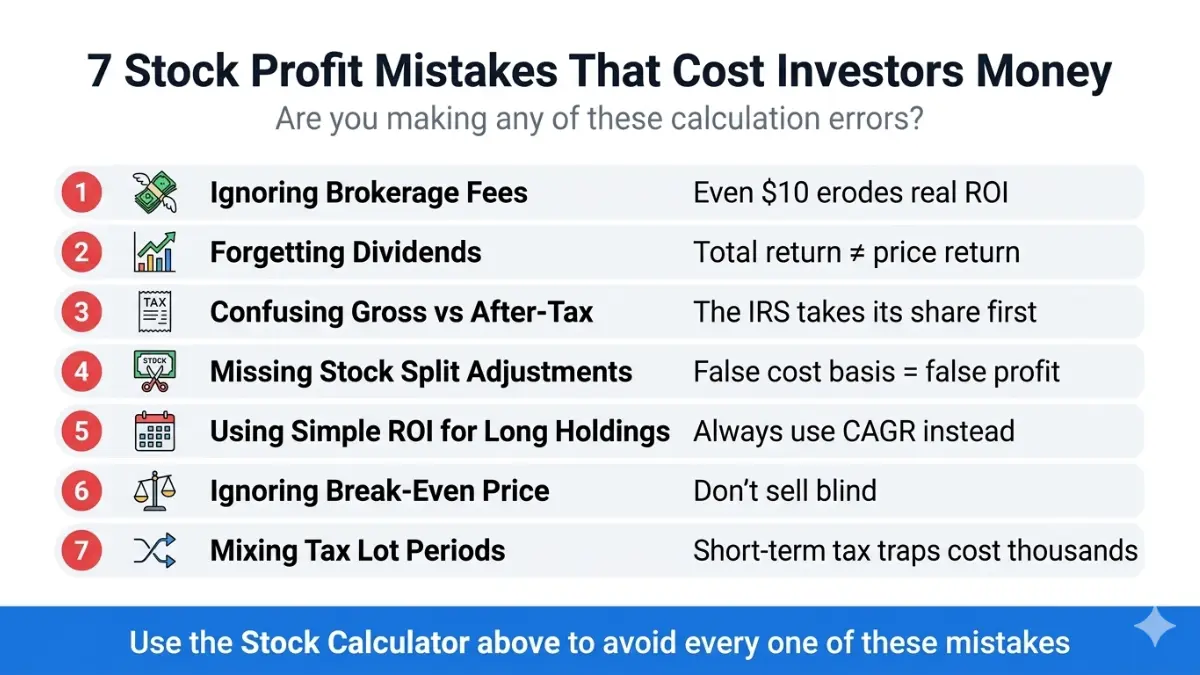
1. Ignoring Brokerage Fees
A $10 round-trip commission on a $500 trade is a 2% automatic loss before the stock moves. Always include buy and sell fees in your stock calculator inputs. On high-frequency trades, fees can consume 15–30% of your actual profit.
2. Forgetting Dividends in Total Return
Price return and total return are not the same. A stock up 8% that paid a 3% dividend delivered an 11% total return. Ignoring dividends causes investors to underestimate returns on income stocks by 20–30% over 10 years. Always input your total cash dividends received.
3. Confusing Gross Profit With After-Tax Profit
Your gross profit is not your take-home money. On a $20,000 gain taxed at the short-term rate (22%), you owe $4,400 to the IRS. Always calculate your after-tax ROI before declaring a trade a success.
4. Failing to Adjust for Stock Splits
If NVIDIA split 10-for-1 after you bought at $800, your cost basis per share is now $80 — not $800. Calculating profit against the pre-split price will show you a false loss on every calculation. Enter splits in the calculator to get accurate numbers.
5. Using Simple ROI for Multi-Year Holdings
Comparing a 3-year stock return to a 1-year bond return using simple ROI is meaningless. Always use CAGR for holdings over 12 months. It’s the only metric that levels the playing field across different time horizons.
6. Ignoring the Break-Even Price Before Selling
Many investors sell at an arbitrary “round number” price without knowing if they’re above or below their actual break-even. Calculate your break-even sell price first — then decide whether to hold, sell, or take a partial position.
7. Mixing Short-Term and Long-Term Positions Without Tracking
Selling shares from different purchase dates in the wrong order can trigger short-term capital gains tax on a position you intended to hold long-term. Track each buy lot separately. The wrong tax treatment on a $50,000 gain could cost you an extra $10,000 in taxes.
Expert Insight: “Many retail investors underestimate their true cost basis because they forget to account for split adjustments, reinvested dividends, and brokerage fees. A comprehensive stock calculator eliminates this guesswork and protects investors from costly tax reporting errors.”
— Michael R. Thompson, CFA | Senior Investment Analyst, financeauthorityhub.com
The SEC’s Investor.gov platform emphasizes that understanding your true investment returns — not just apparent gains — is a foundational requirement for informed investing decisions.
For investors tracking multiple positions, our Investment Calculator and ROI Calculator provide portfolio-level return analysis alongside this stock profit calculator.
Frequently Asked Questions — Stock Calculator
1. What is a stock calculator?
A stock calculator is a free online tool that computes the profit or loss, ROI, CAGR, break-even price, and after-tax returns from buying and selling stocks. It removes manual calculation errors and accounts for fees, dividends, and taxes in a single calculation.
2. How do I calculate profit from selling stock?
Subtract your total cost basis (shares × buy price + buy fee) from your total proceeds (shares × sell price − sell fee), then add any dividends received. The formula is: Net Profit = Proceeds + Dividends − Cost Basis.
3. What is ROI in stock investing?
ROI (Return on Investment) measures your net profit as a percentage of your total cost. Formula: ROI = (Net Profit ÷ Cost Basis) × 100. A 20% ROI means you earned $20 for every $100 invested.
4. What is CAGR and how is it calculated?
CAGR (Compound Annual Growth Rate) is the annualized return of an investment over multiple years. Formula: CAGR = (End Value ÷ Start Value)^(1/Years) − 1. It is the most accurate way to compare multi-year stock performance against benchmarks.
5. How is stock profit taxed in 2026?
Stocks held 12 months or less are taxed as ordinary income (10%–37%). Stocks held over 12 months qualify for long-term capital gains rates of 0%, 15%, or 20%, depending on your taxable income. See the IRS capital gains guide for the official 2026 brackets.
6. What is a break-even stock price?
The break-even price is the minimum sell price at which you recover your full investment including all fees. Formula: Break-Even Price = (Cost Basis − Dividends + Sell Fee) ÷ Shares Sold. Selling above this price generates a profit; below it generates a loss.
7. Does the stock calculator include dividends?
Yes. Enter your total cash dividends received in the “Dividends received” field. The calculator adds dividends to your proceeds to calculate total return — which is how professional investors measure stock performance.
8. How do stock splits affect my profit calculation?
A stock split increases your share count and reduces your price per share proportionally — but does not change your total investment value. The calculator adjusts your split-adjusted shares and average cost automatically when you enter the split ratio.
9. Can I use this calculator for DCA investments?
Yes. Click “Add buy lot” for each purchase entry. The calculator averages your cost basis across all lots and computes your total return accurately — essential for investors who buy consistently over time. For broader DCA strategy planning, explore our Savings Calculator.
10. What is the difference between profit and total return?
Profit = Proceeds − Cost Basis (price change only). Total return includes price change plus dividends received. For dividend-paying stocks, total return can be 20–40% higher than price return over a decade.
11. Is this stock calculator free to use?
Yes. This stock calculator is 100% free with no signup, no account, and no ads. All calculations run directly in your browser. Download your results as a CSV file using the “Download CSV” button.
⚠️ Disclaimer: This stock calculator and all content on this page are for educational and informational purposes only. Results are estimates based on data you enter and do not constitute financial, investment, or tax advice. Tax laws vary by jurisdiction and are subject to change. Please consult a qualified CPA, financial advisor, or tax professional before making investment decisions. Past performance does not guarantee future results. All investments carry risk, including the potential loss of principal. See the SEC’s Investor Education resources for independent investing guidance.
Informational disclaimer
The content on Finance Authority Hub is provided for general informational and educational purposes only and should not be considered personalized financial, investment, tax, legal, or professional advice. Financial decisions depend on your individual goals, income, risk tolerance, location, and regulatory situation. Before acting on any information, strategy, estimate, or calculator result, consult a qualified licensed professional who can evaluate your specific circumstances.