Free Dividend Calculator: DRIP and Passive Income 2026
Dividend Calculator
Compute dividend income, yield, yield-on-cost, taxes, DRIP compounding, and long-term projections with a full yearly schedule and CSV export.
Inputs
Dividend yield is commonly computed as annual DPS ÷ current price. [web:150][web:152]
A DRIP reinvests dividends to buy additional (often fractional) shares, which can compound over time. [web:155]
Results
Investment (shares × price + fees)
—
Annual DPS: —
Dividend yield / Yield-on-cost
Yield: —
YOC: —
Year 1 dividends (gross)
Annual: —
Monthly: —
Per payment: —
Year 1 dividends (after-tax)
Annual: —
Monthly: —
Per payment: —
End of horizon (projection)
End shares: — • End value: — • Portfolio CAGR (approx): —
Total dividends (gross): — • Total dividends (after-tax): —
Reinvested cash: — • Shares added via DRIP: —
Year-by-year projection (very detailed)
| Year | Shares (end) | Price | Annual DPS | Dividends (gross) | Dividends (after-tax) | Reinvest cash | Shares added | Portfolio value |
|---|
This is a model: real dividends and prices vary, and taxes depend on your jurisdiction/account type.
Results appear after you click “Calculate.”
In This Article
A dividend calculator instantly shows you how much passive income your stocks generate — including annual dividend income, monthly income, yield, yield-on-cost, after-tax earnings, and long-term DRIP compounding projections. Enter your shares, share price, dividend per share, payment frequency, and tax rate to see your full picture in seconds.
How to Use This Free Dividend Calculator (Step-by-Step)
This dividend calculator gives you a complete income analysis — not just a basic yield estimate. It covers dividend yield, yield-on-cost, Year 1 gross income, after-tax income, monthly breakdowns, DRIP compounding, and a full year-by-year projection table with CSV export.
Step-by-Step Input Guide
Follow these steps to calculate your dividend income accurately:
- Currency — Select your currency (USD, GBP, CAD, AUD, and 18 others supported).
- Mode — Choose “Dividend income from shares” to estimate what you’ll earn, or “Required investment for target income” to find out how much you need to invest for a specific passive income goal.
- Shares Owned — Enter the number of shares you currently hold. Example: 250.
- Current Share Price — Enter today’s share price. Example: $75.50.
- Buy Fees (Optional) — Add any brokerage commissions you paid. This adjusts your yield-on-cost calculation.
- Annual DPS or Per-Payment DPS — Enter the annual dividend per share (e.g., $2.40), or switch to per-payment if you know the quarterly amount (e.g., $0.60).
- Payment Frequency — Select Monthly, Quarterly, Semi-Annual, or Annual. Most U.S. dividend stocks pay quarterly.
- DRIP Toggle — Enable DRIP to model dividend reinvestment. Add a DRIP discount (0–5% is typical) and an optional DRIP fee if applicable.
- Dividend Growth % and Price Growth % — Optional. Enter the expected annual increase in both dividends and share price to model long-term portfolio growth.
- Projection Horizon — Enter the number of years (1–60). The default is 10 years.
- Click Calculate to see your results instantly.
What You Get in the Results
- Total investment value (shares × price + fees)
- Dividend yield and yield-on-cost (YOC)
- Year 1 annual, monthly, and per-payment income — both gross and after-tax
- End-of-horizon portfolio value and portfolio CAGR
- Total dividends earned over your full projection period
- Shares added via DRIP and total reinvested cash
- Full year-by-year projection table with downloadable CSV
💡 Key Takeaway: Enabling the DRIP toggle is the single most impactful change you can make in this dividend calculator. Over 10–20 years, DRIP compounding can double or triple the income that cash-only dividend investing produces.
Dividend Calculator — Key Formulas You Need to Know
Understanding the math behind your dividend income puts you in control. Here are the four formulas this dividend income calculator uses — explained with real 2026 examples.
Dividend Yield Formula
Dividend Yield (%) = Annual DPS ÷ Current Share Price × 100
Real Example: A stock priced at $75.50 pays an annual dividend of $2.40 per share. Dividend yield = $2.40 ÷ $75.50 × 100 = 3.18%
According to the SEC’s investor education guide on stocks, dividend yield is one of the most important metrics for income-focused investors evaluating a position.
Annual Dividend Income Formula
Annual Income = Shares Owned × Annual DPS
Real Example: 250 shares × $2.40 annual DPS = $600/year = $50/month
This is your gross income before taxes. Use the tax rate field in the calculator to see your after-tax monthly dividend income instantly.
Yield on Cost (YOC) — What Competitors Never Explain
Yield on cost is one of the most powerful metrics in dividend investing — and one that NerdWallet, Bankrate, and Investopedia all fail to explain on their calculator pages.
YOC = Annual DPS ÷ Your Original Cost Basis × 100
Real Example: You bought 250 shares at $60.00 (cost basis = $15,000). The stock now pays $2.40 annual DPS. YOC = $2.40 ÷ $60.00 × 100 = 4.0% — even though current yield is 3.18%.
YOC shows your actual return on your original investment, not the current market price. Long-term dividend investors with strong YOC often earn 8–12% on their original cost within 10–15 years.
DRIP Compounding Formula
FV = P × (1 + r/m)^(m×t)
Where: P = initial investment, r = dividend yield, m = payment frequency per year, t = years.
| Scenario | DRIP OFF | DRIP ON |
|---|---|---|
| Initial Investment | $18,750 (250 shares × $75) | $18,750 |
| Annual DPS | $2.40 (3.2% yield) | $2.40 (3.2% yield) |
| Dividend Growth | 5%/year | 5%/year |
| After 10 Years — Total Dividends | ~$7,547 cash | ~$9,840 + extra shares |
| After 10 Years — Portfolio Value | ~$30,610 | ~$33,890 |
| Difference | — | +$3,280 extra |
Reinvesting dividends buys you more shares, which pay more dividends — a compounding loop that accelerates every year.
DRIP Explained — The Passive Income Multiplier
A Dividend Reinvestment Plan (DRIP) is the single most powerful passive income strategy available to retail investors in 2026. Instead of receiving your dividends as cash, a DRIP automatically uses them to purchase additional shares — often fractional shares — of the same stock.
According to FINRA’s investor education page on stocks, DRIPs automatically reinvest any dividends a company pays out, compounding your ownership stake every payment cycle.
How DRIP Works — Step by Step
- You own 250 shares paying $0.60/quarter ($2.40/year).
- Each quarter, instead of receiving $150 cash, the plan buys new shares at market price.
- At $75/share, that’s approximately 2 new shares added each quarter.
- Next quarter, you now own 252 shares, earning slightly more in dividends.
- This cycle repeats every quarter — compounding passively, without any action from you.
DRIP vs. Cash Dividends — Side-by-Side Comparison
| Feature | DRIP ON ✅ | DRIP OFF 💵 |
|---|---|---|
| Compounding | Automatic, every payment | None |
| Monthly income | Reinvested, not received | Cash in hand |
| Share accumulation | Grows every cycle | Stays flat |
| Tax timing | Taxable in year earned | Same |
| Best for | Long-term wealth building | Retirees needing income now |
| Fractional shares | Yes (most platforms) | N/A |
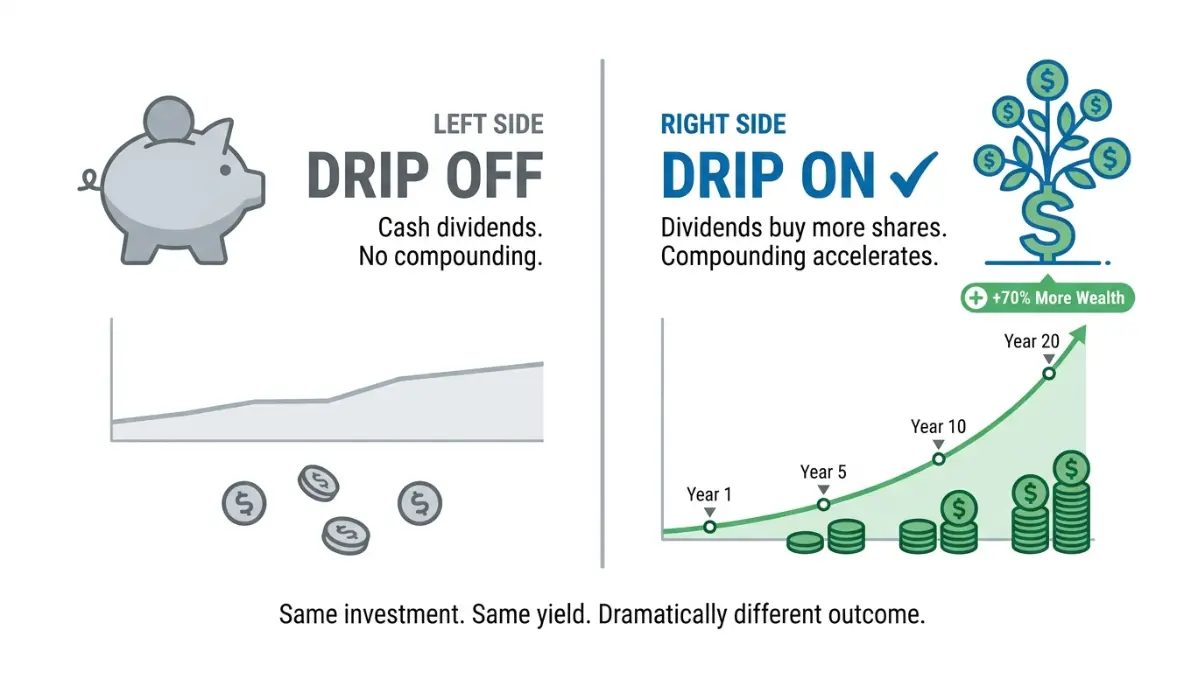
Real DRIP Example — 2026 Numbers
Scenario: 500 shares, $50/share, 4% annual yield, 5% dividend growth, 20-year horizon.
- DRIP OFF: Total dividends collected = ~$67,200 in cash over 20 years.
- DRIP ON: Total value (dividends reinvested + portfolio) = ~$114,500 — a 70% higher outcome.
This is why compound interest is the foundation of all long-term wealth strategies. DRIP applies compound interest directly to your stock portfolio.
When to Turn DRIP Off
DRIP is not always the right choice. Turn it off when:
- You need regular cash income — retirees or those living off dividends.
- The stock is significantly overvalued — reinvesting at a high price reduces your yield-on-cost.
- You want to redirect dividends into a different asset class or debt payoff. Our debt consolidation calculator can help you model which approach saves more.
How Much Do You Need to Invest for $1,000/Month in Dividends?
To generate $1,000/month ($12,000/year) in passive dividend income, you need to invest roughly $200,000 to $400,000 depending on the average yield of your portfolio. At a 4% dividend yield, you need approximately $300,000 invested. At 6%, that drops to $200,000.
This is the most-searched question in dividend investing — and no top-3 competitor provides a clear, ready-to-use table for it.
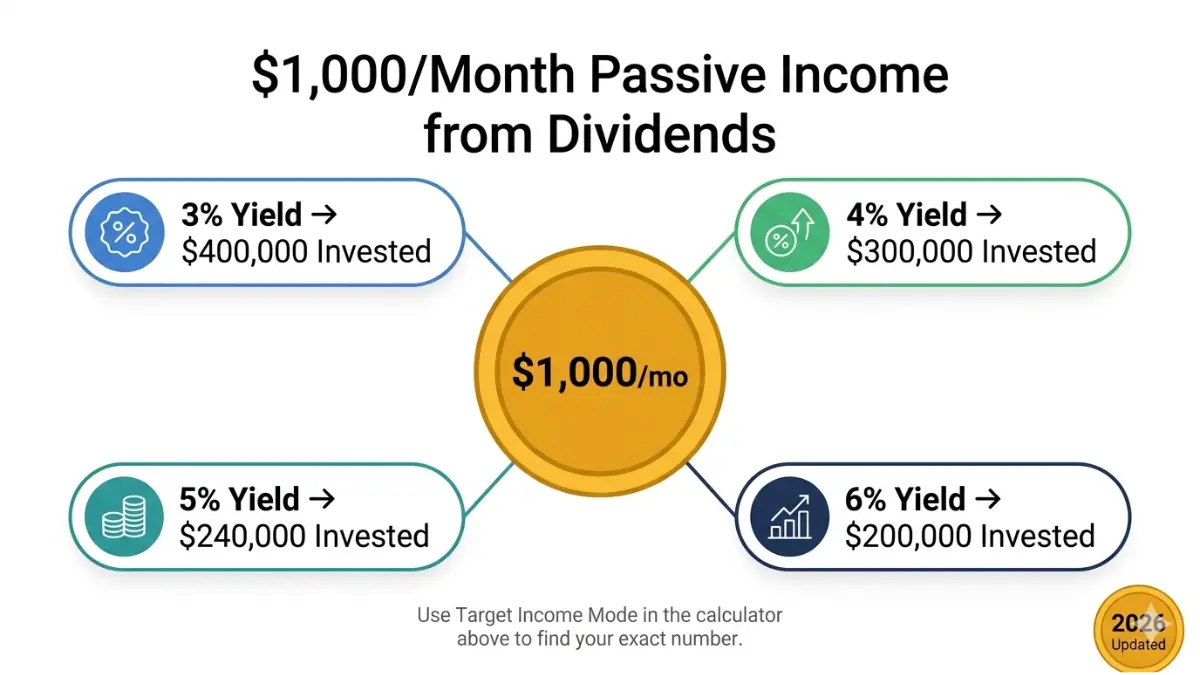
$1,000/Month Dividend Target Table (2026)
| Dividend Yield | Investment Required | Annual Income | Monthly Income |
|---|---|---|---|
| 2.0% | $600,000 | $12,000 | $1,000 |
| 3.0% | $400,000 | $12,000 | $1,000 |
| 4.0% | $300,000 | $12,000 | $1,000 |
| 5.0% | $240,000 | $12,000 | $1,000 |
| 6.0% | $200,000 | $12,000 | $1,000 |
| 7.0% | $171,500 | $12,000 | $1,000 |
$500/Month Dividend Target Table (2026)
| Dividend Yield | Investment Required | Annual Income | Monthly Income |
|---|---|---|---|
| 3.0% | $200,000 | $6,000 | $500 |
| 4.0% | $150,000 | $6,000 | $500 |
| 5.0% | $120,000 | $6,000 | $500 |
| 6.0% | $100,000 | $6,000 | $500 |
💡 Important: These are pre-tax figures. Apply your dividend tax rate (typically 15% for most U.S. investors on qualified dividends) to get your actual take-home monthly income.
How Dividend Growth Changes the Math
Here’s what most investors miss: you don’t need to hit your target yield today. Dividend growth does the work for you over time.
Real Example: Invest $100,000 in a portfolio with a 4% starting yield and 6% annual dividend growth.
- Year 1: Annual income = $4,000 ($333/month)
- Year 5: Annual income = ~$5,352 ($446/month)
- Year 10: Annual income = ~$7,163 ($597/month)
- Year 15: Annual income = ~$9,585 ($799/month)
Your income nearly doubles in 15 years — without adding a single dollar of new investment.
Use the Target Income Mode in our dividend calculator above to enter your desired monthly income and instantly see the exact investment required at any yield. To free up capital to invest, explore our savings calculator for a clear saving roadmap. If you’re also managing a mortgage, our mortgage refinance calculator can lower your monthly obligations and redirect cash toward dividend investing.
Dividend Tax Rates in 2026 — How Much Passive Income Do You Actually Keep?
Gross dividend income and after-tax income are two very different numbers. A 5% dividend yield becomes a 4.25% net yield at a 15% tax rate. Understanding the 2026 dividend tax rules is essential before you project your passive income.
Qualified vs. Ordinary Dividends — The Critical Difference
| Feature | Qualified Dividends ✅ | Ordinary (Non-Qualified) Dividends ⚠️ |
|---|---|---|
| Tax Rate | 0%, 15%, or 20% | Up to 37% (ordinary income rate) |
| Holding Requirement | 60+ days before ex-dividend date | No minimum holding period |
| Examples | Most U.S. common stock dividends | REITs, MLPs, short-term holdings |
| Form | 1099-DIV Box 1b | 1099-DIV Box 1a |
Per IRS Topic 404 on Dividends, qualified dividends are taxed at lower capital gains rates — a significant advantage for long-term investors. Understanding how your dividends are classified can meaningfully increase your after-tax passive income.

2026 Qualified Dividend Tax Rate Table (IRS Updated)
| Filing Status | 0% Rate (Income Up To) | 15% Rate | 20% Rate (Income Above) |
|---|---|---|---|
| Single | $49,950 | $49,951 – $551,350 | $551,350+ |
| Married Filing Jointly | $99,900 | $99,901 – $621,900 | $621,900+ |
| Married Filing Separately | $49,950 | $49,951 – $310,950 | $310,950+ |
| Head of Household | $66,750 | $66,751 – $587,650 | $587,650+ |
What This Means For You: Most middle-income U.S. investors pay just 15% on qualified dividends. If your taxable income is below ~$50,000 as a single filer, your qualified dividends are taxed at 0% — meaning your gross income is your net income.
How to Use the Tax Rate Field in This Calculator
- Find your rate: Check the table above based on your filing status and estimated taxable income.
- Enter it: Type your rate (e.g., 15) into the Dividend Tax Rate field.
- Read the result: The calculator will display your Year 1 after-tax annual income, monthly income, and per-payment income side-by-side with gross figures.
Tax-Advantaged Accounts — The Dividend Investor’s Secret Weapon
Dividends inside a Roth IRA grow and are withdrawn completely tax-free. Inside a traditional IRA or 401(k), dividends are tax-deferred until withdrawal. This is one of the most powerful strategies for maximizing passive income over decades. Use our Roth IRA calculator to model tax-free dividend compounding, or our 401(k) calculator to compare pre-tax growth scenarios side by side.
For additional IRS guidance on reporting reinvested dividends (DRIP distributions are still taxable in the year earned), see FINRA’s cost basis and taxes guide — a critical read for DRIP investors.
If you’re comparing dividend income against other income sources, also review our capital gains tax 2026 guide for a full picture of investment tax strategy.
Dividend Investing Strategy 2026 — Expert Guidance
Reviewed by Laura M. Bennett, CFP® and Daniel Moreau, CPA/CFP — financeauthorityhub.com Expert Panel
Dividend investing in 2026 rewards those who balance yield, safety, and growth. A high yield means nothing if the company cuts the dividend. A low yield means nothing if dividend growth compounds it into a high-income position over time.
What Is a Good Dividend Yield in 2026?
| Yield Range | Interpretation | Typical Examples |
|---|---|---|
| Below 1.5% | Very low; growth-focused | Tech stocks, early-stage growth |
| 1.5% – 3.0% | Healthy, balanced | Blue-chip S&P 500 Dividend Aristocrats |
| 3.0% – 5.0% | Strong income | Consumer staples, utilities, REITs |
| 5.0% – 7.0% | High income — verify sustainability | MLPs, BDCs, high-yield REITs |
| Above 7.0% | Very high — check payout ratio carefully | High risk; potential dividend cuts |
The average S&P 500 dividend yield in early 2026 sits around 1.3–1.5%. Stocks offering 4–6% with consistent payout histories (like Dividend Aristocrats) represent the strongest risk-adjusted income plays for most investors.
Payout Ratio — The Safety Check Every Investor Needs
Payout Ratio = (Annual Dividends Per Share ÷ Earnings Per Share) × 100
| Sector | Safe Payout Ratio Benchmark |
|---|---|
| Consumer Staples / Industrials | Below 60% |
| Utilities | Below 70% |
| REITs (based on FFO) | Below 85% |
| Banks / Financials | Below 50% |
A payout ratio above 90% for a non-REIT stock is a warning sign. The company may be paying out more than it earns — which frequently leads to a dividend cut.
The Dividend Investor’s Checklist (2026)
Before buying any dividend stock, verify:
- ✅ Dividend yield is between 3–6% for income focus
- ✅ Payout ratio is within safe range for its sector
- ✅ 5-year dividend growth streak — look for consistent annual increases
- ✅ Earnings cover the dividend — EPS should exceed DPS
- ✅ Sector diversification — avoid overloading on REITs or energy alone
- ✅ DRIP availability — confirm with your broker
- ✅ Ex-dividend date awareness — you must own shares before this date to receive the next payment
- ✅ Account type — prioritize Roth IRA or 401(k) for tax efficiency

Top Dividend Investing Mistakes to Avoid in 2026
- Chasing yield blindly — a 10% yield is often a red flag, not a reward
- Ignoring payout ratio — high dividends with high payout ratios are fragile
- Skipping DRIP during accumulation years — costs you significant compounding
- Holding dividend stocks in taxable accounts when Roth IRA space is available
- Ignoring dividend growth — a 3% yield growing at 8%/year beats a static 6% yield over 10 years
What This Means For You: Run your current portfolio through the Target Income Mode in our dividend calculator above to see exactly how far you are from your $500, $1,000, or $2,000/month passive income goal — and what adjustments get you there faster.
To build a complete wealth strategy alongside dividend investing, explore our investment calculator, retirement calculator, and our full guide on how to start investing with $100. For a deeper look at how dividends fit into your overall income plan, our retirement savings by age guide provides expert-backed benchmarks for every stage of life.
Frequently Asked Questions About Dividend Calculators
1. What is a dividend calculator?
A dividend calculator is a free tool that estimates the passive income you can earn from dividend-paying stocks. It calculates dividend yield, annual income, monthly income, after-tax returns, and long-term DRIP compounding projections based on your inputs.
2. How do I calculate dividend yield?
Use the formula: Dividend Yield = Annual DPS ÷ Current Share Price × 100. Example: $2.40 annual DPS ÷ $75.50 share price = 3.18% yield.
3. What is DRIP in dividend investing?
DRIP (Dividend Reinvestment Plan) automatically reinvests your dividend payments to buy more shares instead of paying you cash. Over time, this compounds your share count and passive income significantly. Most major U.S. brokers offer DRIP enrollment at no cost.
4. How much do I need to invest for $1,000/month in dividends?
At a 4% average dividend yield, you need approximately $300,000 invested to generate $1,000/month ($12,000/year) in gross dividend income. At 6% yield, that drops to $200,000. Use the Target Income Mode in our calculator above for your exact figure.
5. What is yield on cost (YOC)?
Yield on cost is your annual dividend income divided by your original purchase price — not the current share price. It shows your true return on investment. Long-term dividend investors often achieve YOC of 8–12% on shares bought years ago at lower prices.
6. What is a good dividend yield in 2026?
A yield of 3–5% from a financially sound company is generally considered healthy in 2026. Yields above 7% warrant extra scrutiny — they often signal elevated payout ratios or business risk.
7. How are dividends taxed in 2026?
Qualified dividends (most U.S. stock dividends) are taxed at 0%, 15%, or 20% depending on your income. Non-qualified dividends are taxed as ordinary income at up to 37%. See the IRS 2026 thresholds in Section 5 above or visit IRS Topic 404 for full guidance.
8. Can I use this dividend calculator for UK, Canada, or Australia?
Yes. Our calculator supports 22 currencies including GBP, CAD, and AUD. Simply select your currency from the dropdown. Note that dividend tax rules vary by country — consult a local tax professional for jurisdiction-specific rates.
9. What is the dividend payout ratio?
The payout ratio = Annual DPS ÷ EPS × 100. It measures what percentage of earnings a company pays as dividends. Below 60% is generally safe for most sectors; above 90% is a warning sign for non-REITs.
10. Does reinvesting dividends really make a big difference?
Yes — dramatically. In the DRIP example in Section 3, a 20-year DRIP strategy produced 70% more wealth than taking dividends as cash. The compounding effect of buying more shares each quarter accelerates over every decade you hold.
11. How do I start dividend investing as a beginner?
Open a brokerage account, fund it, then search for Dividend Aristocrats (S&P 500 companies with 25+ consecutive years of dividend increases). Enable DRIP, keep a diversified portfolio across 3–5 sectors, and monitor payout ratios annually. Our beginner’s guide to investing with $100 is the ideal next step.
⚠️ Disclaimer: This dividend calculator and article are for educational and informational purposes only and do not constitute financial, tax, or investment advice. Dividend yields, returns, and projections shown are estimates and are not guaranteed. Past dividend payments are not a guarantee of future payments. Tax thresholds are based on 2026 IRS guidance and may be subject to change. Please consult a licensed financial advisor or CPA before making investment decisions.
Informational disclaimer
The content on Finance Authority Hub is provided for general informational and educational purposes only and should not be considered personalized financial, investment, tax, legal, or professional advice. Financial decisions depend on your individual goals, income, risk tolerance, location, and regulatory situation. Before acting on any information, strategy, estimate, or calculator result, consult a qualified licensed professional who can evaluate your specific circumstances.