NASDAQ Composite: Why 47% Own Just 10 Stocks
The NASDAQ Composite tracks 3,500+ stocks, but 10 companies control 47% of returns—the highest concentration since 2000. Discover hidden risks and protection strategies for 2026.
In This Article
Your NASDAQ Composite index fund promises diversification across 3,500 companies. The reality? Just 10 stocks control 47% of your returns, creating the most concentrated index structure since the 2000 dot-com bubble. If you own NASDAQ-tracking ETFs like QQQ or ONEQ, you’re essentially betting on a handful of mega-cap tech giants—whether you realize it or not.
The Shocking Truth About Your NASDAQ Investment
The NASDAQ Composite tracks over 3,500 stocks listed on the Nasdaq exchange, but this breadth masks a critical concentration problem. According to Nasdaq’s official methodology, the index uses market capitalization weighting, meaning larger companies automatically receive proportionally larger weightings.
Here’s what this means in practice:
- Apple alone: 12.3% of total index weight ($3.4 trillion market cap)
- Top 3 stocks (Apple, Microsoft, Nvidia): 33% combined weight
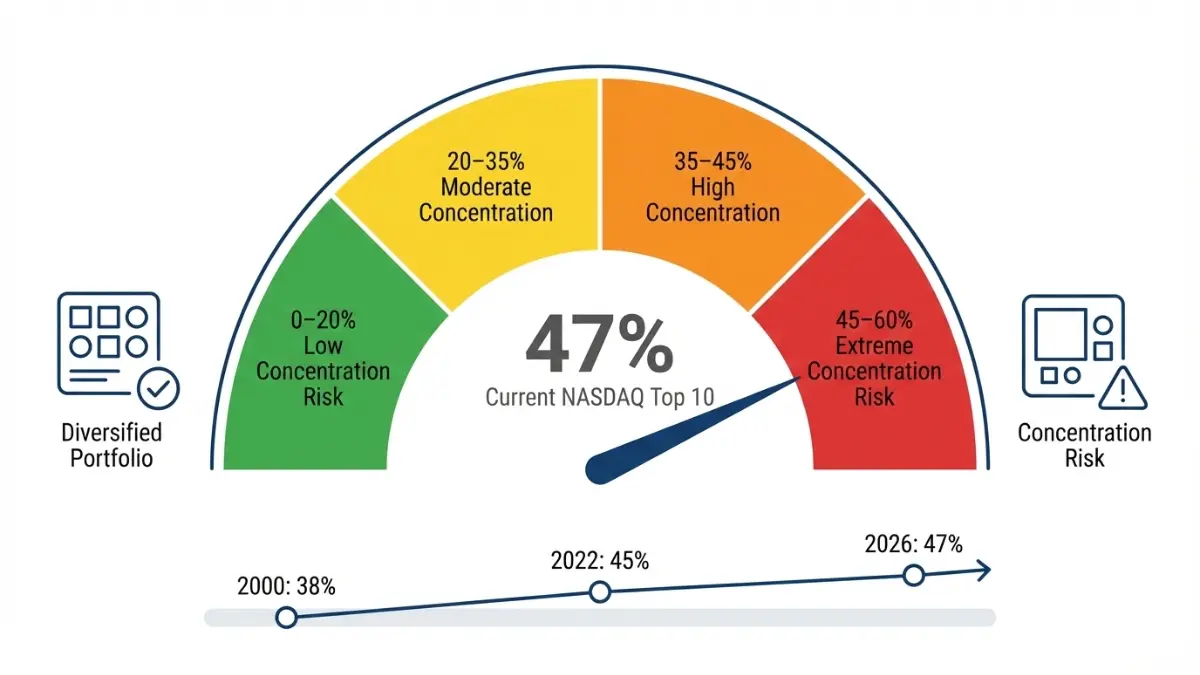
- Top 10 stocks: 47% of total index performance
- Remaining 3,490+ stocks: Just 53% of index weight
This creates a startling reality: when you invest $1,000 in a NASDAQ Composite index fund, $470 immediately flows into just 10 companies. The “diversified” portfolio you thought you purchased concentrates nearly half your capital in a tiny fraction of holdings.
Why This Matters in 2026
Market concentration hasn’t been this extreme since March 2000, right before the tech bubble collapsed 78%. Three critical factors make 2026 especially risky:
Trump tariff uncertainty: New administration policies threaten tech supply chains, particularly semiconductor imports from Taiwan and manufacturing in China.
AI spending skepticism: The “Magnificent 7” tech giants (Apple, Microsoft, Nvidia, Amazon, Alphabet, Meta, Tesla) are spending over $200 billion annually on AI infrastructure with unclear revenue returns.
Earnings growth deceleration: Magnificent 7 profit growth is slowing to 18% in 2026, down from 30%+ in prior years—narrowing the performance gap with the broader S&P 500.
What happens if Apple drops 10%? Your NASDAQ index fund could fall 4.9% from that single stock move alone. When Meta Platforms lost $230 billion in market value on February 3, 2022, the NASDAQ Composite plunged 2.4% in a single session despite 3,500 other stocks in the index.
How Market Cap Weighting Creates Concentration
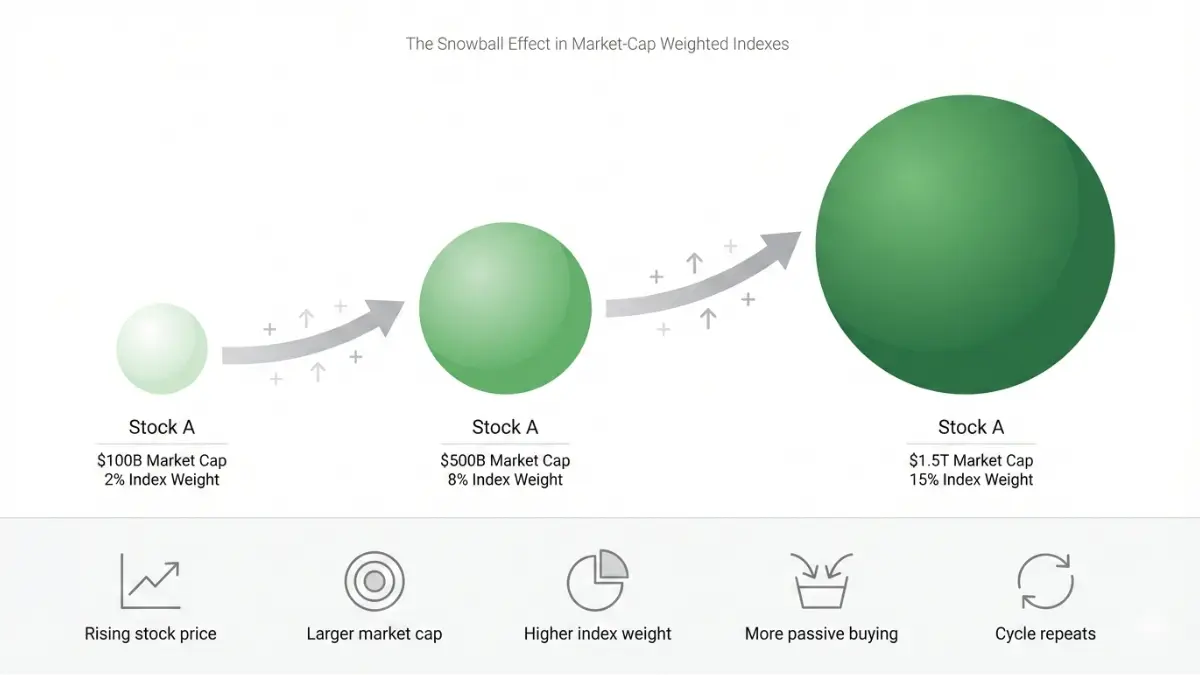
Understanding why the NASDAQ Composite became so top-heavy requires examining its fundamental index construction methodology. Unlike equal-weight strategies that assign the same percentage to each stock, market cap weighting creates a mathematical snowball effect.
The Math Behind NASDAQ’s Top-Heavy Structure
Market capitalization weighting calculates each company’s index weight using this formula:
Company Weight = (Stock Price × Shares Outstanding) ÷ Total Index Market Cap
When a stock’s price rises, its market cap increases, automatically boosting its index weight. This creates a self-reinforcing cycle:
- Tech stock performs well
- Market cap increases
- Index weight automatically rises
- Passive index funds must buy more shares
- Additional buying pressure pushes price higher
- Cycle repeats
Similar to how budgeting with a home affordability calculator reveals where your money truly goes, analyzing NASDAQ weights shows where your investment dollars actually concentrate.
Top 10 NASDAQ Composite Holdings (January 2026)
| Rank | Company | Ticker | Index Weight | Market Cap | Sector |
|---|---|---|---|---|---|
| 1 | Apple | AAPL | 12.3% | $3.4T | Technology |
| 2 | Microsoft | MSFT | 11.8% | $3.2T | Technology |
| 3 | Nvidia | NVDA | 8.9% | $2.4T | Technology |
| 4 | Amazon | AMZN | 6.2% | $1.7T | Consumer |
| 5 | Alphabet | GOOGL | 5.8% | $1.6T | Technology |
| 6 | Meta | META | 4.1% | $1.1T | Technology |
| 7 | Tesla | TSLA | 3.2% | $870B | Consumer |
| 8 | Broadcom | AVGO | 2.9% | $790B | Technology |
| 9 | Costco | COST | 1.6% | $435B | Consumer |
| 10 | Amgen | AMGN | 1.3% | $352B | Healthcare |
| Total | Top 10 | – | 47.1% | $17.8T | – |
Data compiled from Nasdaq official sources and verified market data as of January 29, 2026.
The Magnificent 7 Phenomenon
Seven technology giants—Apple, Microsoft, Nvidia, Amazon, Alphabet, Meta, and Tesla—dominate not just the NASDAQ Composite but the entire U.S. stock market. These companies generated spectacular returns from 2023-2025:
- 2023: +43.4% (NASDAQ Composite)
- 2024: +28.6%
- 2025: +20.3%
However, 2026 presents a different picture. Through January 30, the Magnificent 7 index sits flat while the equal-weight S&P 500 (RSP) gained 3.3%—a dramatic reversal showing concentration risk cutting both ways.
Why Passive Investing Amplifies Concentration
Approximately 54% of all fund assets now employ passive index-tracking strategies, according to SEC data on investment trends. These passive funds have zero discretion—they must buy whatever stocks the index dictates, in exact proportion to market cap weights.
This creates an unprecedented feedback loop:
More money → passive funds → automatic buying of largest stocks → prices rise → market caps increase → weights grow → more automatic buying
Active managers can reduce exposure to overvalued stocks. Passive investors cannot. You own the index weights regardless of valuation, creating systematic concentration that intensifies during bull markets.
What This Means For You: Every dollar invested in NASDAQ Composite index funds automatically concentrates 47 cents into 10 companies with zero regard for current valuations or future prospects.
5 Critical Risks of NASDAQ Concentration
Understanding concentration is one thing. Recognizing the specific dangers helps investors make informed decisions about portfolio allocation—similar to how understanding credit card debt strategies helps avoid financial pitfalls.
Risk #1: Single-Stock Disaster Scenarios
When Meta Platforms missed earnings expectations on February 3, 2022, the stock lost $230 billion in market value—the largest single-day loss in U.S. stock market history. The NASDAQ Composite fell 2.4% that day despite 3,500 other stocks in the index.
2026 vulnerability: Microsoft’s heavy AI infrastructure spending raised concerns in early January 2026 earnings. The stock dropped 12% post-earnings, dragging the NASDAQ Composite down 1.3% despite positive results from hundreds of other companies.
A concentrated index magnifies single-stock risks. When 12% of your index lives in one company (Apple), corporate missteps translate directly to portfolio damage.
Risk #2: Sector Rotation Away From Tech
Historical precedent warns of concentration dangers. During the 2000-2002 tech crash, the NASDAQ Composite plummeted 78% peak-to-trough. The recovery took 15 years—investors who bought at the March 2000 peak didn’t break even until 2015.
2026 catalyst: Equal-weight strategies attracted $397 million in new flows in early 2026 as investors sought to reduce tech concentration. When capital rotates from growth to value stocks, concentrated tech indices suffer disproportionately.
Shocking statistic: In 2025, 630 NASDAQ stocks outperformed Nvidia from a price-performance perspective. Yet Nvidia contributed more to index returns than those 630 stocks combined due to its massive weight. This reveals how size, not merit, drives concentrated index performance.
Risk #3: Regulatory Crackdowns
The Department of Justice currently investigates multiple Magnificent 7 companies for potential antitrust violations. The European Union’s Digital Markets Act imposes significant restrictions on large tech platforms.
2026 uncertainty: New U.S. administration policies toward big tech remain unpredictable. Regulatory actions could force business model changes, impacting the profitability of companies representing 47% of the NASDAQ Composite.
Breaking up a dominant tech company would devastate index returns given extreme concentration—an outcome impossible in a truly diversified portfolio.
Risk #4: AI Bubble Concerns
The Magnificent 7 collectively spend over $200 billion annually on AI infrastructure—data centers, chips, power facilities, and software. Revenue returns remain largely theoretical for most companies.
Valuation compression risk: Magnificent 7 stocks trade at 29x forward earnings versus 22x for the S&P 500. While down from 40x+ multiples earlier in the decade, valuations demand perfect execution.
If AI monetization disappoints or takes longer than expected, current valuations could compress rapidly. With 47% of index weight in these expensive stocks, the NASDAQ Composite offers little margin for error.
Risk #5: Geopolitical Supply Chain Disruption
Taiwan Semiconductor Manufacturing Company (TSMC) produces the majority of advanced chips for Apple, Nvidia, and other tech giants. Geopolitical tensions with China create existential supply chain risks.
Trump tariff proposals: Campaign promises to impose 60% tariffs on Chinese imports and 10-20% on all imports would devastate tech companies dependent on Asian manufacturing. Apple assembles iPhones in China, while Nvidia sources components globally.
A single geopolitical event affecting semiconductor supply could crater multiple NASDAQ Composite top holdings simultaneously—concentration magnifying geographic risk.
NASDAQ Composite Historical Drawdowns
| Period | Peak-to-Trough Decline | Recovery Time | Top 10 Concentration |
|---|---|---|---|
| 2000-2002 | -78% | 15 years | 38% |
| 2007-2009 | -54% | 3 years | 42% |
| 2022 | -33% | 18 months | 45% |
| 2026 Current | TBD | TBD | 47% |
Source: Analysis of Nasdaq historical data and Federal Reserve Economic Data
The relationship is clear: higher concentration correlates with longer, more severe drawdowns when markets correct.
Why Smart Investors Accept Concentration Risk
Despite concentration risks, the NASDAQ Composite remains popular for legitimate reasons. Just as index funds vs mutual funds each offer distinct advantages, concentrated tech exposure serves specific portfolio purposes.
The Innovation Premium
Technology represents 56% of NASDAQ Composite weight for sound economic reasons. These companies generate massive cash flows, dominate global markets, and drive productivity gains across the entire economy.
AI revolution: Still in early innings, artificial intelligence could transform every industry over the next decade. The Magnificent 7 possess the capital, talent, and infrastructure to capture AI’s economic value.
Network effects: Companies like Meta (3 billion users), Amazon (200 million Prime members), and Microsoft (400 million Office 365 subscribers) have built nearly impenetrable competitive moats through network effects and switching costs.
Excluding technology from portfolios means missing the economy’s growth engine—a tradeoff some investors aren’t willing to accept.
Superior Historical Returns
Concentration delivered spectacular returns over the past three years:
- NASDAQ Composite 2023-2025: 43.4%, 28.6%, 20.3% = 118% cumulative
- S&P 500 same period: 24%, 19%, 16% = 70% cumulative
- Premium: 48 percentage points over three years
For investors with higher risk tolerance and longer time horizons, concentration risk may be worth the return potential. Similar to how retirement planning in your 30s emphasizes growth over preservation, younger investors might intentionally overweight concentrated growth indices.
Liquidity and Accessibility
NASDAQ Composite exposure costs almost nothing:
- Invesco QQQ (NASDAQ-100): 0.20% expense ratio
- Fidelity ONEQ (NASDAQ Composite): 0.21% expense ratio
Low costs mean investors keep more returns. Additionally, these ETFs trade with massive daily volume, ensuring easy entry and exit even with large positions.
Tax efficiency: Holding NASDAQ ETFs in retirement accounts like 401(k) or IRA accounts maximizes tax-deferred growth on concentrated technology exposure.
The “Don’t Fight Big Tech” Argument
Magnificent 7 companies collectively hold over $500 billion in cash and equivalents on their balance sheets. This financial firepower enables:
- Acquisitions: Buying threatening competitors before they scale
- R&D spending: Outinvesting smaller rivals 100-to-1
- Market share defense: Price cuts, promotions, and subsidies impossible for cash-strapped competitors
Pricing power: Unlike commodity businesses, these companies set prices due to lack of true substitutes. Microsoft can raise Office 365 prices. Apple maintains iPhone pricing power. Amazon Web Services commands premium margins.
For investors who believe technology dominance persists, concentration represents feature rather than bug.
What This Means For You: Concentration creates risk, but completely avoiding tech means missing the sector driving economic growth, innovation, and productivity gains.
6 Strategies to Navigate NASDAQ Concentration in 2026
Understanding concentration risks and opportunities enables smarter portfolio construction. These actionable strategies balance tech exposure with prudent risk management—similar to how debt consolidation strategies balance multiple financial goals.
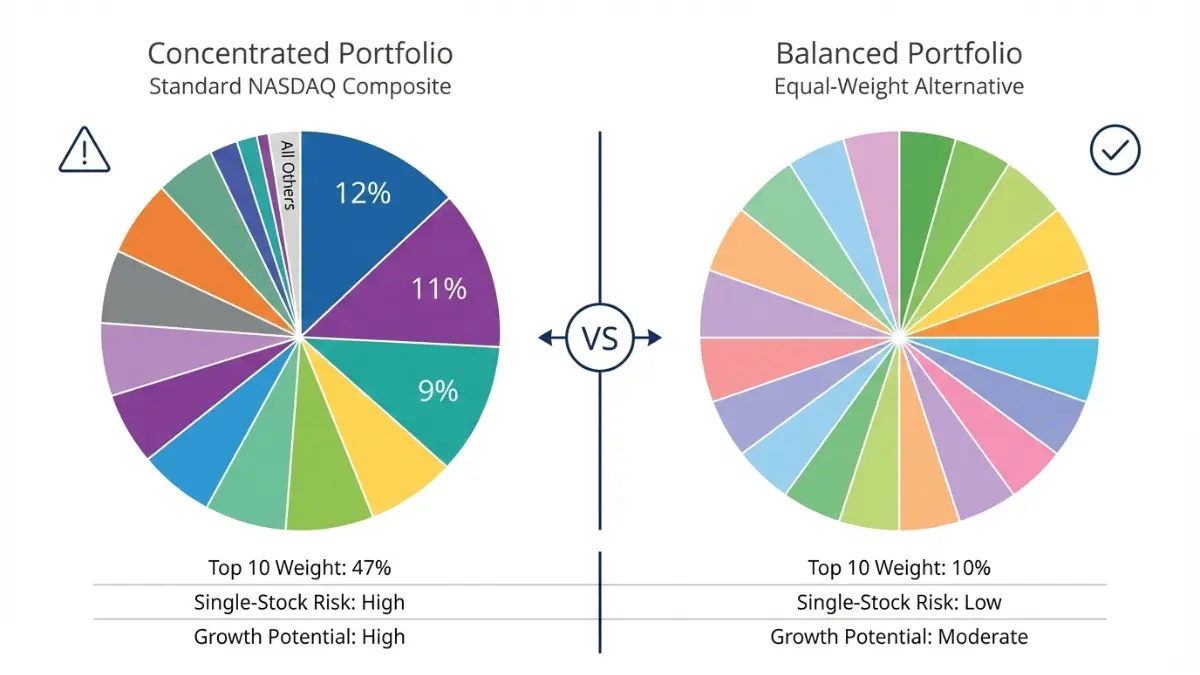
Strategy #1: Embrace Equal-Weight Alternatives
Standard NASDAQ indices concentrate capital in largest stocks. Equal-weight versions spread investments evenly across all holdings, dramatically reducing single-stock risk.
Product comparison:
- Invesco QQQ (QQQ): Market-cap weighted NASDAQ-100 tracker, top 10 = 47% weight
- Invesco S&P 500 Equal Weight (RSP): Each stock gets ~0.2% weight regardless of size
- Performance divergence: RSP gained 3.3% YTD 2026 vs market-cap S&P 500 up just 0.7%
Equal-weight funds reduce concentration but sacrifice some growth potential during tech rallies. They work best for investors seeking broad market exposure without extreme concentration.
Strategy #2: Cap Your Tech Exposure
The SEC recommends diversification across asset classes to reduce portfolio risk. Financial advisors typically suggest limiting any single sector to 20-30% of total portfolio value.
Recommended allocation framework:
- Growth sleeve: 20-25% NASDAQ Composite for technology exposure
- Core holdings: 40-45% S&P 500 or total stock market index
- Value stocks: 15-20% small-cap value or dividend aristocrats
- Bonds: 10-20% based on age and risk tolerance
- Cash: 5-10% for opportunities and emergencies
This approach maintains technology exposure while preventing concentration from dominating your entire financial picture—similar to how budgeting with the 50-30-20 rule balances multiple spending categories.
Strategy #3: Dollar-Cost Average Into Volatility
Concentrated indices experience violent price swings. Apple dropped 20% through August 2024 before surging 34% by year-end. Rather than trying to time these moves, systematic investing smooths concentration risk.
Monthly investment approach:
- Set fixed dollar amount ($500, $1,000, etc.)
- Invest same amount monthly regardless of price
- Buy more shares when prices fall, fewer when they rise
- Let time and consistency overcome volatility
Dollar-cost averaging works especially well for NASDAQ Composite concentration because you’ll accumulate shares during inevitable tech selloffs. The next downturn creates buying opportunities rather than panic.
Many best investment apps offer automatic recurring investments, making this strategy effortless.
Strategy #4: Harvest Tax Losses on Laggards
Five of seven Magnificent 7 stocks traded down in early 2026 despite the broader market rising. This creates tax optimization opportunities.
Tax-loss harvesting process:
- Sell losing positions (Apple, Tesla, etc.) to realize capital loss
- Use losses to offset capital gains or up to $3,000 ordinary income
- Immediately purchase equal-weight alternative to maintain market exposure
- Avoid wash sale rules (wait 30 days before repurchasing identical security)
Example scenario: You bought QQQ at $450 in November 2024. It trades at $420 in January 2026. Sell for $3,000 loss, buy RSP (equal-weight) immediately to maintain market exposure, use loss to offset taxes.
This strategy works within the same tax year or carried forward to future years. Understanding how tax refunds work helps maximize this opportunity.
Strategy #5: Add International Tech Exposure
NASDAQ Composite = 95% U.S. companies. This geographic concentration creates additional risk when combined with sector concentration.
International tech diversification:
- European tech: ASML (semiconductor equipment), SAP (enterprise software), Spotify (streaming)
- Asian semiconductors: Taiwan Semiconductor (TSMC), Samsung, SK Hynix
- Emerging market tech: Alibaba, Tencent, MercadoLibre
ETF options:
- iShares MSCI ACWI ex U.S. (ACWX): International stocks excluding U.S.
- Vanguard FTSE All-World ex-US (VEU): Developed and emerging markets
- SPDR S&P World ex-US (GWL): Focus on developed international markets
International exposure diversifies away from Silicon Valley concentration while maintaining technology sector participation.
Strategy #6: Monitor Valuation Metrics Religiously
The 2000 tech crash devastated investors who ignored valuations. NASDAQ Composite reached 200x price-to-earnings ratio at the peak—a level that proved unsustainable.
Key ratio to track: Magnificent 7 P/E vs NASDAQ Composite P/E
- Current (Jan 2026): 29x vs 25x = reasonable premium
- Concerning level: >40x = bubble territory
- Danger zone: >50x = extreme overvaluation likely to correct
Additional metrics:
- Price-to-sales: Tech stocks trading >15x sales face compression risk
- Free cash flow yield: Below 2% suggests overvaluation
- PEG ratio: P/E divided by growth rate; above 2.0 = expensive
Set quarterly calendar reminders to review these metrics. When valuations reach extreme levels, reduce NASDAQ exposure regardless of recent performance.
Financial discipline prevents the classic investor mistake of buying high and selling low—much like how systematic debt payoff methods require consistent execution.
Action Steps Summary
- Audit current portfolio: Log into 401(k), IRA, brokerage accounts and calculate total tech exposure percentage
- Calculate concentration: Add up all technology sector holdings (NASDAQ funds + individual tech stocks)
- Assess risk tolerance: If tech exceeds 30% of portfolio and you can’t stomach a 50% drawdown, rebalance
- Implement gradual shifts: Move 5-10% from concentrated NASDAQ into equal-weight funds over 3-6 months
- Set quarterly review: Calendar reminders to check valuations and rebalance when weightings drift
Small, consistent actions compound into significant risk reduction over time—just as systematic savings plans build wealth incrementally.
What to Expect from NASDAQ Composite in 2026-2027
Professional forecasters offer varied NASDAQ Composite predictions for 2026-2027, reflecting uncertainty about concentration dynamics, earnings growth, and AI monetization timelines.
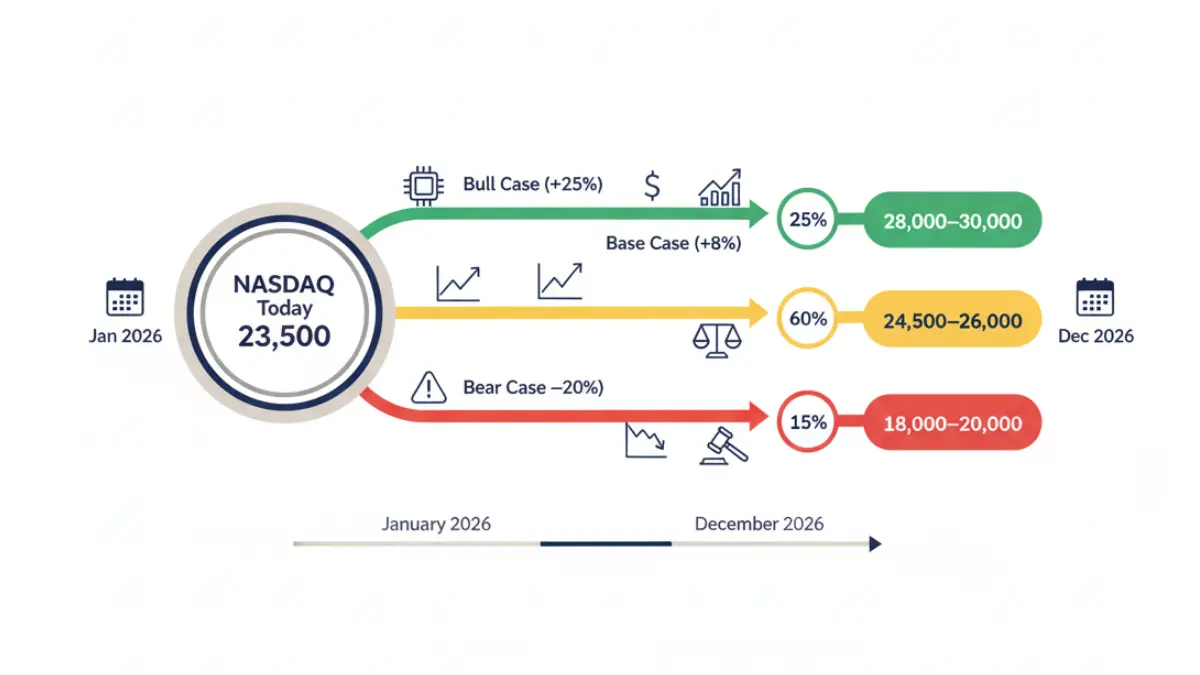
Base Case Scenario (60% probability)
Earnings growth: 15-18% for Magnificent 7, slightly above S&P 500’s 13%
Concentration: Remains 45-50% in top 10 stocks
Volatility: Moderate with quarterly swings of 5-10%
Year-end 2026 target: 24,500-26,000
This scenario assumes AI spending eventually generates returns justifying current valuations, no major regulatory crackdowns materialize, and geopolitical tensions remain manageable. NASDAQ Composite delivers modest single-digit gains with higher volatility than broader indices.
The base case resembles 2016-2019 market conditions—steady growth without euphoria, occasional corrections that recover within months.
Bull Case (25% probability)
Catalysts:
- AI monetization accelerates faster than expected
- Deregulation boosts tech sector margins
- Fed rate cuts stimulate growth-stock valuations
- Market broadens but tech maintains leadership
Year-end 2026 target: 28,000-30,000 (+20-25% gain)
The bull case requires multiple positive developments aligning simultaneously. Historical comparisons include 1995-1999 when tech dominated and concentration actually helped returns.
Tech valuations remain reasonable versus historic averages. Magnificent 7 trading at 29x earnings isn’t extreme compared to 2021’s 40x+ multiples. If earnings growth meets or exceeds expectations, current prices could prove conservative.
Bear Case (15% probability)
Catalysts:
- Recession triggered by tariffs or Fed policy error
- AI bubble bursts as monetization disappoints
- Regulatory crackdowns break up big tech
- Concentration unwinds violently (2000 repeat)
Year-end 2026 target: 18,000-20,000 (-15 to -25% decline)
The bear case mirrors 2000-2002 dynamics: excessive concentration in overvalued stocks, disappointing revenue growth relative to infrastructure spending, and regulatory threats forcing business model changes.
Unlike 2000 when many tech companies were unprofitable, today’s Magnificent 7 generate massive cash flows. However, this doesn’t guarantee immunity from severe corrections if sentiment shifts.
Final Takeaway: NASDAQ Composite’s 47% concentration in 10 stocks represents both opportunity and vulnerability. The index isn’t “good” or “bad”—it’s a tool appropriate for specific portfolio roles when sized correctly.
Informed investors don’t avoid concentration—they acknowledge it, size positions appropriately for their risk tolerance and time horizon, and maintain diversification across the rest of their portfolio.
Consider starting with our financial planning tools at financeauthorityhub.com/tools to assess your overall financial picture before making investment decisions.
Frequently Asked Questions
1. What are the top 10 stocks in NASDAQ Composite by weight?
Apple (12.3%), Microsoft (11.8%), Nvidia (8.9%), Amazon (6.2%), Alphabet (5.8%), Meta (4.1%), Tesla (3.2%), Broadcom (2.9%), Costco (1.6%), and Amgen (1.3%) comprise the top 10 holdings representing 47% of total index weight as of January 2026.
2. Is 47% concentration dangerous for investors?
Concentration increases volatility and single-stock risk but has historically delivered superior returns during technology bull markets. The danger depends on portfolio size, risk tolerance, and whether you maintain diversification in other holdings.
3. How does NASDAQ concentration compare to S&P 500?
S&P 500’s top 10 stocks represent approximately 40% of index weight while NASDAQ’s top 10 comprise 47%. Both indices show historically extreme concentration, with NASDAQ slightly more top-heavy due to higher technology sector weighting.
4. Should I avoid NASDAQ index funds in 2026?
No—but limit technology exposure to 20-30% of total portfolio value for balanced risk management. NASDAQ funds work well as growth sleeves within diversified portfolios rather than as standalone core holdings.
5. What’s the difference between NASDAQ Composite and NASDAQ-100?
NASDAQ Composite tracks 3,500+ stocks including all Nasdaq-listed companies. NASDAQ-100 tracks only the largest 100 non-financial companies, representing roughly 80% overlap in market-cap weighting with the Composite but excluding smaller stocks.
6. Can the Magnificent 7 sustain their market dominance?
Unclear—earnings growth for the Magnificent 7 is slowing to 18% in 2026 from 30%+ in prior years. Market dominance depends on AI monetization success, regulatory environment, and whether new competitors emerge to challenge their market positions.
7. How do I invest in NASDAQ Composite directly?
Purchase ETFs that track the index: Fidelity NASDAQ Composite Index ETF (ONEQ) with 0.21% expense ratio, or Invesco QQQ (tracks NASDAQ-100) with 0.20% expense ratio. Both trade like stocks through any brokerage account.
8. What happened during the 2000 NASDAQ crash?
The NASDAQ Composite declined 78% from March 2000 peak to October 2002 trough. Recovery took 15 years—the index didn’t regain its 2000 peak until 2015. Extreme concentration (38% in top 10) magnified the collapse.
9. Are equal-weight NASDAQ funds better than market-cap weighted?
Equal-weight funds reduce concentration risk and outperform during periods of sector rotation away from largest stocks. However, they underperform market-cap weighted indices during strong technology rallies. Choose based on your concentration risk tolerance.
10. How often should I rebalance NASDAQ holdings in my portfolio?
Review quarterly and rebalance when technology sector exceeds your target allocation by more than 5 percentage points. Some investors rebalance annually, while others use 10% drift thresholds. Consistency matters more than specific frequency.
11. Do international investors face different NASDAQ risks?
Yes—currency fluctuation adds another layer of risk and potential return. Non-U.S. investors also face U.S.-specific regulatory risks, tax complexity, and potential capital controls. However, the underlying concentration risk remains identical regardless of investor location.
Disclaimer
This article is for educational purposes only and does not constitute financial advice. Investing in the NASDAQ Composite index or any securities carries market risk including potential loss of principal. Individual investment decisions should consider personal financial situations, time horizons, and risk tolerance. Past performance does not guarantee future results. Tax implications vary by individual circumstance and jurisdiction. Consult a licensed financial advisor, tax professional, or attorney before making investment decisions. The information presented reflects market conditions as of January 30, 2026, and may change. Portfolio allocation recommendations represent general guidelines, not personalized advice.
Informational disclaimer
The content on Finance Authority Hub is provided for general informational and educational purposes only and should not be considered personalized financial, investment, tax, legal, or professional advice. Financial decisions depend on your individual goals, income, risk tolerance, location, and regulatory situation. Before acting on any information, strategy, estimate, or calculator result, consult a qualified licensed professional who can evaluate your specific circumstances.