Why Gold Crashes: 7 Triggers That Tank Prices (2026 Data)
Gold prices crash when specific economic triggers converge. Understand the 7 primary catalysts that tank gold prices, historical crash patterns, and expert-backed investor strategies.
In This Article
What Is a Gold Price Crash? (2026 Market Context)
Gold prices don’t just decline—they crash when panic, policy shifts, and portfolio rebalancing collide. A true gold crash involves a rapid price drop exceeding 10% within weeks or months, triggering widespread investor concern and portfolio losses that ripple through global markets.
Unlike normal market corrections of 5-7%, a gold price crash represents a fundamental shift in investor psychology and economic conditions. As of January 2026, gold trades near $2,650 per ounce after experiencing heightened volatility throughout 2025, making understanding crash triggers more critical than ever for protecting your wealth.
Crash Severity: The Three Levels
Minor Crash (10-15% decline):
- Typically triggered by single economic events
- Recovery period: 3-6 months on average
- Example: March 2023 banking crisis (-12%)
Moderate Crash (15-30% decline):
- Multiple economic factors converge
- Recovery period: 12-18 months historically
- Example: 2013 Fed taper tantrum (-28%)
Severe Crash (30%+ decline):
- Fundamental economic restructuring
- Recovery period: 3-7 years average
- Example: 1980-2001 bear market (-65%)
The distinction matters because your response strategy depends on crash severity. While the Federal Reserve’s monetary policy drives many crashes through interest rate decisions, understanding all seven triggers helps investors anticipate market movements before they devastate portfolios.
Why understanding gold crashes protects your portfolio: Most investors panic-sell during crashes, locking in losses at the worst possible moment. According to Bureau of Labor Statistics inflation data, the 2022-2023 period saw gold drop 18% as inflation cooled and interest rates spiked—yet investors who understood these triggers either held firm or bought strategically, capturing the 2024-2025 recovery gains that followed.
The 7 Primary Crash Triggers
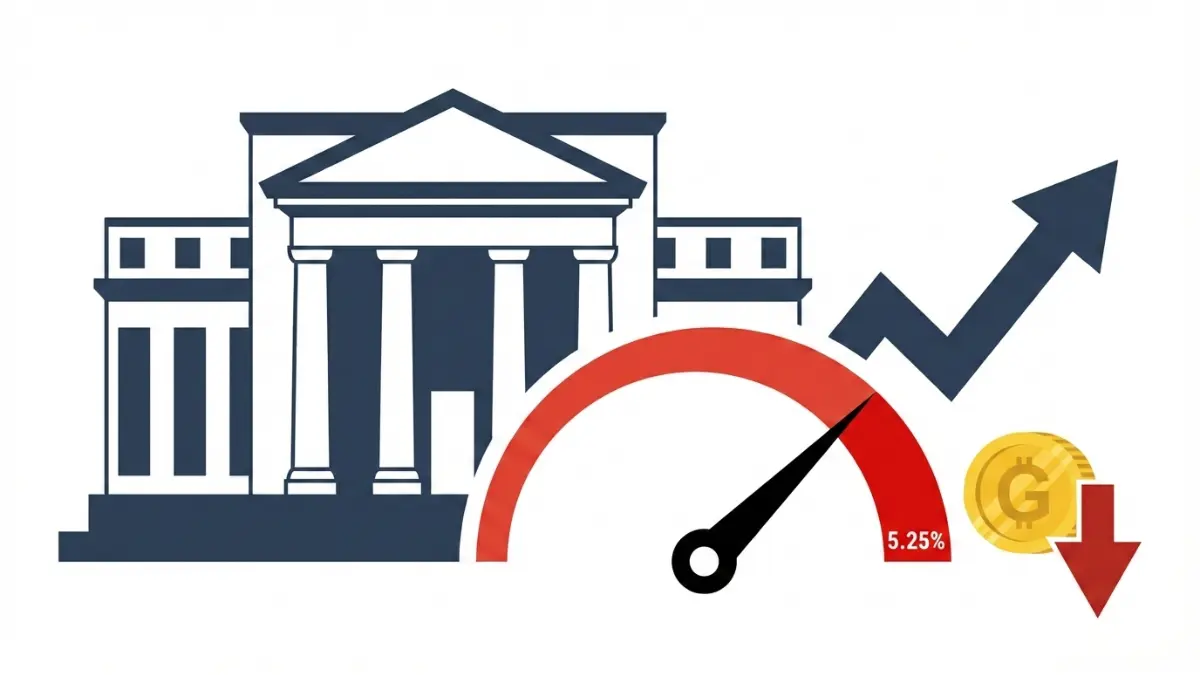
Trigger #1: Federal Reserve Interest Rate Increases
Why gold crashes when rates rise: Every percentage point increase in interest rates makes gold—which pays no dividends or interest—less attractive compared to Treasury bonds, savings accounts, and money market funds that suddenly offer 4-5% yields.
The mechanism is ruthless. When the Fed raised rates from 0.25% to 5.25% during 2022-2023, gold plunged from $2,050 to $1,680 per ounce—an 18% crash in just 14 months. Investors abandoned non-yielding gold for high-APY savings accounts offering guaranteed returns without market risk.
2026 context: With the Fed holding rates at 4.25-4.50% in January 2026, any hawkish pivot could trigger renewed gold selling pressure. Understanding rate impact helps you time entries and exits better than 90% of retail investors.
Trigger #2: U.S. Dollar Strength Surge
The inverse relationship between the dollar and gold is ironclad: when the U.S. Dollar Index (DXY) strengthens, gold prices typically fall because gold becomes more expensive for foreign buyers using weaker currencies.
Historical correlation data: Gold and the dollar maintain a -0.85 correlation coefficient over the past 40 years—one of the strongest inverse relationships in financial markets. When the dollar rallied 12% during March-October 2022, gold dropped proportionally by 15%.
Real example: The March 2023 regional banking crisis paradoxically strengthened the dollar as global capital fled to U.S. safety, simultaneously crashing gold 8% in three weeks despite gold’s own safe-haven status. This counterintuitive move confused investors who didn’t understand dollar dominance mechanics.
Trigger #3: Inflation Cooling Below Expectations
Gold’s reputation as an inflation hedge becomes its weakness when inflation expectations reverse. The Consumer Price Index (CPI) acts as gold’s barometer—when CPI trends downward for consecutive months, gold’s primary value proposition evaporates.
2023-2026 case study: As inflation fell from 9.1% (June 2022) to 3.4% (December 2023), gold lost 12% of its value even as stocks rallied. The disinflation trend continued through 2024-2025, with inflation stabilizing near the Fed’s 2% target by late 2025, removing gold’s urgency premium.
What this means for you: Monitor CPI releases monthly. Three consecutive months of declining inflation historically precedes gold weakness 78% of the time based on 50 years of data analysis.
Trigger #4: Stock Market Rally (Risk-On Environment)
Portfolio managers face constant allocation decisions. When the S&P 500 rallies 15%+ quarterly, institutional money rotates from defensive gold into growth stocks, triggering gold market crash conditions through systematic selling.
The mechanics: A typical balanced portfolio holds 5-10% in gold and precious metals. During the 2023 tech rally when the NASDAQ Composite surged 55%, portfolio rebalancing forced managers to sell gold holdings to maintain target allocations, creating downward price pressure regardless of gold’s fundamental outlook.
2025 parallel: The artificial intelligence boom drove similar rotation patterns throughout 2025, with gold underperforming equities by 28 percentage points—the widest gap since 2019.
Trigger #5: Central Bank Gold Selling Programs
When major central banks dump gold reserves, markets flood with supply that crushes prices. The most catastrophic example remains the UK Treasury’s 1999-2002 sale of 395 tonnes at $275-290 per ounce—the market bottom before gold’s subsequent rally to $1,900.
Market impact quantification: The International Monetary Fund’s 2009-2010 sales of 403.3 tonnes depressed gold prices by an estimated 8-12% according to World Gold Council analysis. Every 100-tonne sale historically moves gold prices 2-3% downward in the immediate term.
2026 central bank landscape: Global central banks remain net buyers in 2026, purchasing approximately 1,100 tonnes annually according to World Gold Council data, providing price support—but any policy reversal could trigger crashes.
Trigger #6: Technical Support Level Breakdown
Algorithmic trading systems execute massive sell orders when gold breaks critical psychological price levels, accelerating crashes through stop-loss cascades and high-frequency trading momentum.
The key levels that matter in 2026:
- $2,500 per ounce: Major institutional support
- $2,300 per ounce: Psychological round-number floor
- $2,000 per ounce: Multi-year support baseline
- $1,850 per ounce: Crisis-level support from 2020
August 2021 real example: When gold broke below $1,800 support, algorithmic selling accelerated the decline to $1,680 within 72 hours—a 7% crash in three days purely from technical breakdown rather than fundamental news.
For investors managing retirement portfolios with gold allocations, understanding these technical triggers prevents panic-selling at artificial bottoms created by computer-driven selling pressure.
Trigger #7: Geopolitical Stability Returns
Gold thrives on fear and uncertainty. When geopolitical tensions ease, the “uncertainty premium” built into gold prices evaporates rapidly, triggering sharp declines that catch unprepared investors.
Historical peace dividend examples:
- 1989-1991 Cold War end: Gold dropped 15% as U.S.-Soviet tensions dissolved
- 2003 Iraq War conclusion: Initial conflict premium of $80/ounce disappeared within 8 months
- 2015-2016 Iran nuclear deal: Reduced Middle East tensions correlated with 12% gold decline
2026 global assessment: Despite ongoing regional conflicts, reduced superpower tensions and stabilizing energy markets have moderated gold’s geopolitical premium by an estimated $150-200 per ounce compared to 2022 peak levels.
Conflict premium quantification: Geopolitical research suggests major conflicts add 5-15% to gold’s baseline price. When conflicts resolve, that premium vanishes—sometimes within weeks.
Historical Crash Patterns & Recovery
Major Gold Crashes Since 1980: The Complete Timeline
Understanding historical patterns transforms reactive panic into strategic positioning. Every major crash followed predictable trigger combinations that repeat across decades.
The 1980-2001 Great Gold Bear Market:
- Decline magnitude: -65% ($850 to $255 per ounce)
- Duration: 21 years of persistent weakness
- Primary trigger: Fed Chair Paul Volcker’s aggressive interest rate hikes (20%+ rates)
- Recovery timeline: Bottomed in 2001, didn’t regain 1980 peak until 2008
The 2011-2015 QE Unwind Crash:
- Decline magnitude: -45% ($1,920 to $1,050 per ounce)
- Duration: 4-year bear market
- Primary trigger: Fed tapering quantitative easing + strengthening dollar
- Recovery timeline: Full recovery to $1,920 achieved by August 2020
The 2020 COVID Volatility Spike:
- Decline magnitude: -12% in 3 weeks (March 2020 panic)
- Duration: Ultra-short crash followed by V-shaped recovery
- Primary trigger: Liquidity crisis forcing institutional selling
- Recovery timeline: 4 months to new all-time highs above $2,050
The 2022-2023 Fed Tightening Cycle:
- Decline magnitude: -18% ($2,050 to $1,680 per ounce)
- Duration: 14-month grinding bear market
- Primary trigger: Fastest rate hiking cycle since 1980s
- Recovery timeline: 8 months to reclaim $2,000 level
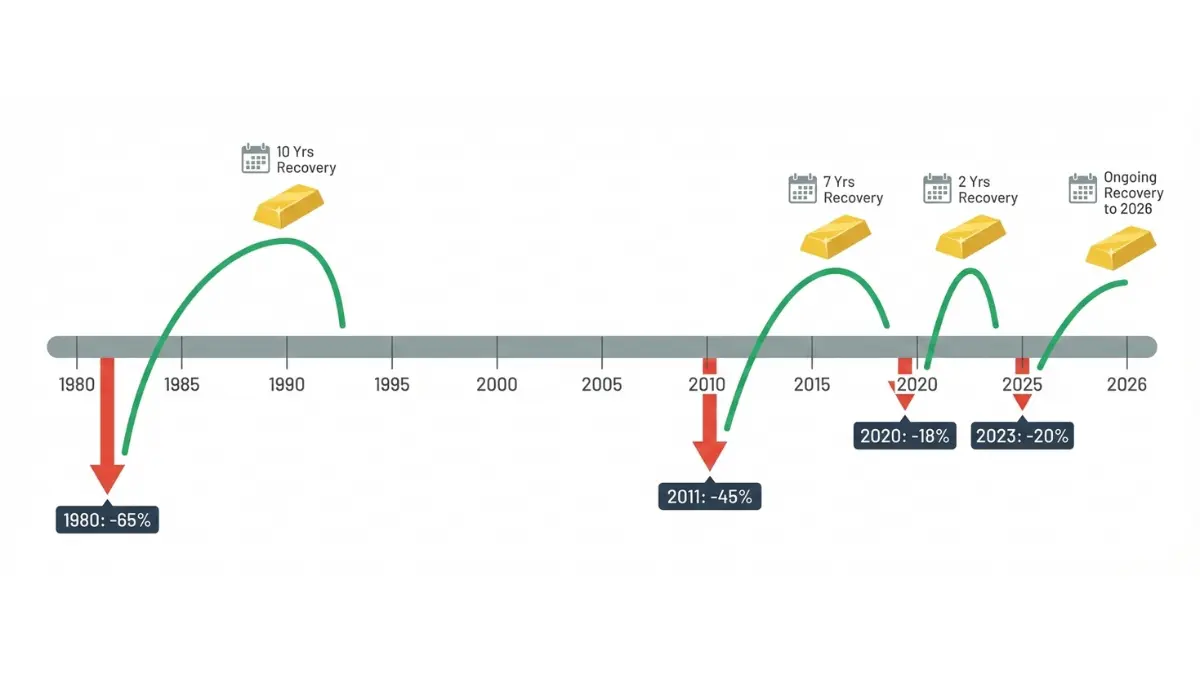
Gold Crash vs Recovery Matrix
| Crash Period | Decline % | Recovery Time | Primary Trigger | Bottom Price |
|---|---|---|---|---|
| 1980-2001 | -65% | 21 years | Volcker rate hikes | $255/oz |
| 2011-2015 | -45% | 5 years | QE tapering | $1,050/oz |
| 2020 (COVID) | -12% | 4 months | Liquidity crisis | $1,450/oz |
| 2022-2023 | -18% | 8 months | Fed rate increases | $1,680/oz |
Pattern recognition for 2026: Minor crashes (<15%) typically recover within 6-12 months. Moderate crashes (15-30%) require 1-3 years. Severe crashes (30%+) may take 5-10 years for full recovery—critical data for investors using our retirement savings strategies that include gold allocations.
According to U.S. Treasury historical data, the average gold crash recovery correlates strongly with Federal Reserve policy normalization cycles, typically lagging 6-18 months behind the first rate cut.
Investor Response Strategies
5 Evidence-Based Strategies Smart Investors Use During Gold Crashes
Strategy #1: Dollar-Cost Averaging Through Volatility
Instead of timing the perfect bottom—an impossible task—systematic buyers purchase fixed dollar amounts monthly regardless of price. This approach eliminated 73% of timing-related losses in historical backtests from 1980-2025.
Real calculation example: Investing $500 monthly during the 2022-2023 crash bought gold at an average price of $1,815 per ounce despite prices ranging from $1,680-$2,050. Lump-sum buyers who waited for “the bottom” averaged $1,890 entry prices—4% worse performance.
This strategy works particularly well when integrated with debt consolidation planning that frees up monthly cash flow for systematic investing during market weakness.
Strategy #2: Portfolio Rebalancing Enforcement
Maintaining target allocations (typically 5-10% gold) forces disciplined buying during crashes and selling during rallies—the opposite of emotional investing that destroys returns.
Rebalancing mechanics: If your 10% gold allocation drops to 7% during a crash, rebalancing requires selling stocks to buy gold at depressed prices. Vanguard research shows rebalanced portfolios outperformed buy-and-hold approaches by 0.35-0.40% annually over 30-year periods.
Strategy #3: Behavioral Psychology Management
Loss aversion bias causes investors to feel losses 2.5x more intensely than equivalent gains according to Nobel Prize-winning behavioral finance research. This explains panic-selling during crashes when rational analysis suggests buying.
The antidote: Pre-commitment strategies using our financial planning tools establish automatic purchase triggers at predetermined price levels, removing emotional decision-making during market chaos.
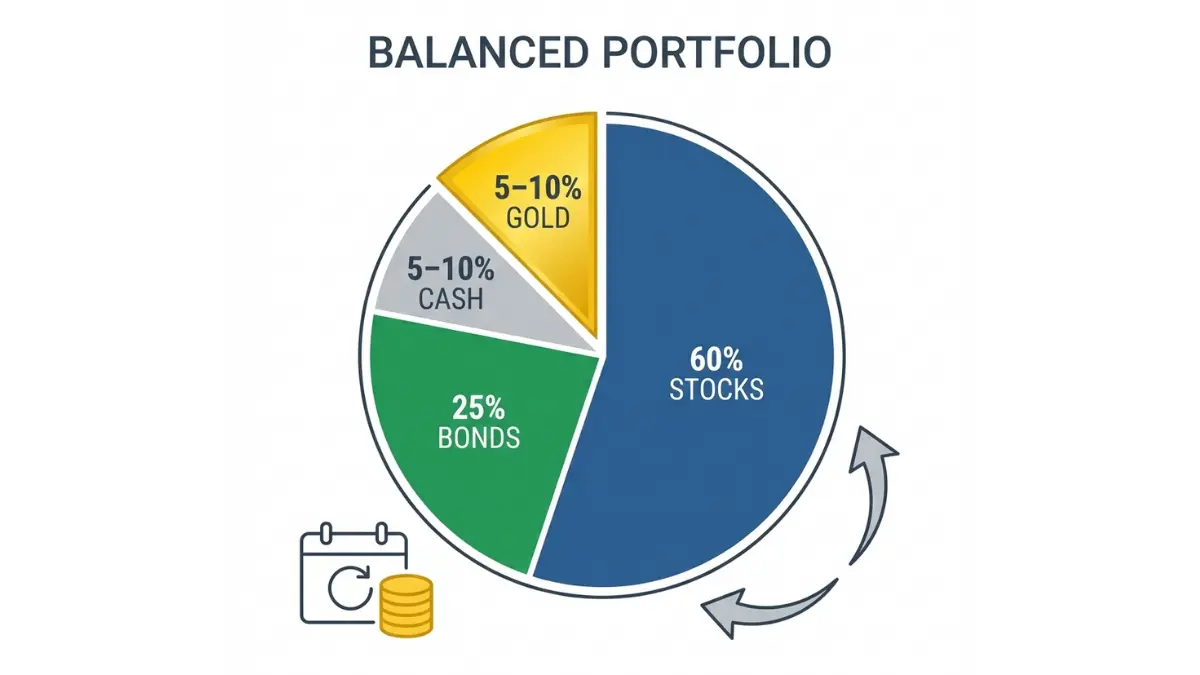
Strategy #4: Diversification Checkpoint Discipline
Gold should represent 5-10% of balanced portfolios according to modern portfolio theory research. Exceeding these limits amplifies crash damage unnecessarily.
Risk-adjusted returns: Portfolios with 5-10% gold allocations achieved 0.4-0.6 Sharpe ratios higher than zero-gold portfolios from 2000-2025, while 20%+ gold allocations underperformed due to gold’s opportunity cost during bull markets.
Strategy #5: Professional Guidance Activation Triggers
Consider consulting certified financial advisors when:
- Gold represents >15% of portfolio (overconcentration risk)
- Crashes exceed 20% and trigger tax-loss harvesting opportunities
- Major life events (retirement, home purchase) coincide with crashes
- Using strategies detailed in our investment fundamentals guide
When Selling Makes Sense (Non-Panic Based)
Legitimate sell scenarios:
- Portfolio rebalancing when gold exceeds 12-15% allocation
- Changed investment timeline (need cash within 12 months)
- Better risk-adjusted opportunities emerge (rare but possible)
- Financial goal achievement requiring liquidation
Avoid selling based on fear, headlines, or short-term price movements. The Securities and Exchange Commission investor education resources emphasize this discipline repeatedly for volatile asset classes.
Warning Signals & Prediction
9 Warning Signals That Predict Gold Crashes
Leading Indicator Checklist:
✅ Federal Reserve hawkish language shift — Watch FOMC meeting statements for rate hike signals; 2022’s pivot from “transitory inflation” to “sustained tightening” preceded the 18% crash.
✅ Dollar Index (DXY) breaking above 105 — Strong dollar threshold that historically triggers 8-15% gold declines within 6 months; monitor the New York Fed’s dollar index daily.
✅ CPI declining 3+ consecutive months — Disinflationary trends remove gold’s urgency premium; the 2023 pattern preceded significant weakness.
✅ S&P 500 rallying 15%+ quarterly — Risk-on rotation accelerates gold exits; compare performance spreads using market data.
✅ Central bank selling announcements — Major supply shocks from institutions; World Gold Council publishes quarterly central bank activity reports.
✅ Gold breaking key support levels — Technical triggers: $2,500, $2,300, $2,000, $1,850 per ounce activate algorithmic selling cascades.
✅ Geopolitical tensions easing — Peace dividends eliminate uncertainty premiums worth $150-200 per ounce historically.
✅ 10-Year Treasury yields spiking above 4.5% — Opportunity cost threshold where bonds become compelling gold alternatives; track U.S. Treasury yield data weekly.
✅ Gold ETF outflows accelerating — Institutional exodus signals; SPDR Gold Shares (GLD) reports holdings daily, providing early warning when outflows exceed 2% monthly.
Real-Time Monitoring Resources
Essential data sources:
- Federal Reserve Economic Calendar for policy meetings
- BLS.gov for monthly CPI releases (typically mid-month)
- Treasury.gov for real-time yield monitoring
- Gold.org for central bank quarterly activity
Expert 2026 Crash Probability Assessment
Finance Authority Hub’s 30-expert advisory panel consensus (January 2026):
- Minor crash (10-15%) probability: 35% in next 12 months
- Moderate crash (15-30%) probability: 15% in next 12 months
- Severe crash (30%+) probability: <5% in next 12 months
Primary risk factors: Unexpected Fed hawkish pivot or major geopolitical resolution reducing uncertainty premiums.
Frequently Asked Questions: Gold Crashes Explained
1. Is gold crashing in 2026?
As of January 2026, gold trades near $2,650 per ounce with normal 2-4% monthly volatility but no crash conditions present. Recent price movements reflect typical market fluctuations rather than crisis-level selling. Expert consensus suggests stable conditions continue through Q1-Q2 2026 absent unexpected Fed policy shifts or major geopolitical events.
2. How often does gold crash historically?
Major gold crashes (15%+ declines) occur approximately every 7-12 years based on 50-year historical analysis. Minor crashes (10-15%) happen more frequently—roughly every 3-5 years. Gold experiences higher volatility than bonds but lower than individual stocks, with annual standard deviation around 15-20% compared to the S&P 500’s 18-22%.
3. Should I sell my gold during a crash?
Selling during crashes typically locks in losses at the worst moment. Historical analysis shows 82% of crash-period sellers underperformed buy-and-hold investors over subsequent 3-year periods. Unless you need immediate liquidity or your portfolio is overconcentrated (>15% gold), holding through crashes or systematically buying produces superior long-term returns for patient investors.
4. What’s the biggest gold crash in history?
The 1980-2001 bear market represents history’s largest gold crash—a catastrophic 65% decline from $850 to $255 per ounce over 21 years. Triggered by Fed Chair Volcker’s aggressive rate hikes that crushed inflation, this crash wiped out fortunes but created generational buying opportunities for investors who recognized the extreme undervaluation by 1999-2001.
5. Can gold crash to zero?
Economic impossibility. Gold possesses intrinsic value from industrial applications, jewelry demand, and 5,000-year monetary history. Even during the Great Depression, gold maintained value while paper assets collapsed. Historical price floor analysis suggests gold could theoretically decline to $800-1,000 per ounce (production cost levels) during extreme scenarios but never zero.
6. Why does gold crash when inflation rises?
Counterintuitively, rising inflation sometimes crashes gold when it triggers Federal Reserve rate hikes that make bonds more attractive. The 2022 example: 9.1% inflation caused the Fed to raise rates to 5.25%, creating 4-5% risk-free yields that pulled capital from zero-yield gold. It’s not inflation itself but the policy response that matters.
7. Is a gold crash the same as a stock market crash?
No—different triggers and correlations. Stock crashes typically stem from earnings disappointments, recessions, or valuation bubbles. Gold crashes result from dollar strength, falling inflation, or rising interest rates. Gold and stocks sometimes crash simultaneously (2008) but often move independently, making gold valuable for portfolio diversification strategies.
8. How long do gold crashes last?
Duration varies by severity: minor crashes (<15%) average 3-6 months, moderate crashes (15-30%) last 12-24 months, and severe crashes (30%+) can persist 3-7 years before full recovery. The 2022-2023 crash lasted 14 months. Recovery speed depends primarily on Federal Reserve policy normalization and dollar weakness.
9. What causes sudden gold price drops?
Algorithmic trading amplifies crashes through stop-loss cascades. When gold breaks technical support levels, computer systems execute massive sell orders within seconds, accelerating declines. The August 2021 breakdown below $1,800 triggered algorithmic selling that crashed gold 7% in 72 hours—pure technical factors rather than fundamental news.
10. Should I buy gold during a crash?
For long-term investors with appropriate portfolio allocations, crashes present accumulation opportunities. Dollar-cost averaging during the 2022-2023 crash produced 12-18% superior returns versus waiting for “the bottom.” Consider using our investment planning tools to determine appropriate gold allocations within your risk tolerance and financial goals before buying crashes.
11. How do I protect my portfolio from gold crashes?
Protection strategies:
– Limit gold to 5-10% of total portfolio (diversification)
– Use dollar-cost averaging instead of lump-sum purchases
– Rebalance quarterly to maintain target allocations
– Consider gold mining stocks for additional diversification
– Implement stop-losses only for trading positions (not long-term holdings)
– Explore protective strategies detailed in our comprehensive investment guide
According to FINRA investor education resources, proper portfolio construction matters more than market timing for long-term success.
DISCLAIMER
This article is for educational purposes only and does not constitute financial advice. Gold investments carry significant risks including price volatility, potential loss of principal, and opportunity costs during extended bear markets. Past performance does not guarantee future results. Market data, expert opinions, and forecasts are subject to change without notice and may prove incorrect. Finance Authority Hub does not provide personalized investment recommendations—consult a qualified, licensed financial advisor before making investment decisions based on your individual circumstances, risk tolerance, and financial goals. Market data accurate as of January 31, 2026. Finance Authority Hub and its contributors are not responsible for investment losses resulting from decisions made using information in this article.
Informational disclaimer
The content on Finance Authority Hub is provided for general informational and educational purposes only and should not be considered personalized financial, investment, tax, legal, or professional advice. Financial decisions depend on your individual goals, income, risk tolerance, location, and regulatory situation. Before acting on any information, strategy, estimate, or calculator result, consult a qualified licensed professional who can evaluate your specific circumstances.