Inflation Calculator — Is Your Money Losing Value?
Inflation Calculator
Convert money across time using either a constant inflation rate (compounding) or CPI start/end values. Get purchasing power ratios and detailed yearly/monthly schedules.
Inputs
Uses compounding (like \(FV = PV(1+i)^n\)). [web:93]
Results
Start amount
—
Start: —
Future equivalent
—
End: —
Inflation over period
Cumulative inflation: —
Avg annual inflation: —
Avg monthly inflation: —
Purchasing power
Purchasing-power ratio: —
Duration: — months (— years)
Year-by-year schedule
| Year | Start value | End value | Change | % change |
|---|
Month-by-month schedule
| Month | Start value | End value | Change |
|---|
Results appear after you click “Calculate.”
In This Article
Yes, your money is losing value right now. The U.S. inflation rate stands at 2.4% as of February 2026, according to the Bureau of Labor Statistics. That means $1,000 sitting idle today buys noticeably less than it did just five years ago. Use our inflation calculator above to find the exact dollar impact — then read on to understand what it means for your savings, salary, and financial future.
What Is an Inflation Calculator — and Why Does It Matter in 2026?
An inflation calculator converts money across time using either a constant inflation rate or CPI start and end values. It shows you the real purchasing power of a dollar — what $500 in 2015 would cost today, or what $1,000 today might be worth in 2030.
In 2026, this tool is more relevant than ever. Here’s why:
2026 Inflation Snapshot (February Data — Source: BLS)
| Category | 12-Month Change |
|---|---|
| All Items (CPI) | 2.4% |
| Food | 3.1% |
| Healthcare | 3.4% |
| Airline Tickets | 7.1% |
| College Tuition | 2.0% |
| Energy | Declining |
What this means in real dollars: $10,000 in January 2020 would need to be approximately $12,500 today just to maintain the same purchasing power — a 25% cumulative erosion. You can verify this instantly using our inflation rate calculator at the top of this page.
5 Real Situations Where a CPI Calculator Changes Your Financial Decisions:
- Checking if your salary truly kept up with rising living costs
- Planning how much to save for retirement in inflation-adjusted terms
- Comparing home prices from 5 or 10 years ago in real terms
- Understanding whether your savings account is actually growing
- Calculating the real cost of a loan or mortgage over time
If you’re planning major purchases, our home affordability calculator helps you factor in inflation-adjusted purchasing power before committing to a home.
How to Use This Inflation Calculator — Step-by-Step
Our tool goes far beyond basic competitors. It supports two calculation methods and delivers monthly breakdowns, yearly schedules, and downloadable CSV data. Here’s how to use it:

Method 1: Annual Inflation Rate (Compound Rate)
This is the most common approach. Use it when you want to calculate inflation adjusted value based on a fixed percentage rate.
Steps:
- Select your currency (USD, GBP, CAD, AUD, and 18 others)
- Choose Direction — Forward (today → future cost) or Backward (past amount → today’s money)
- Enter your amount (e.g., $1,000)
- Set Start Date and End Date
- Select “Use annual inflation rate (%)” as the method
- Enter the rate — use 2.4% for the current U.S. rate, or any custom rate
- Click Calculate
Method 2: CPI Start & End Values
Use this when you have actual Consumer Price Index data from the BLS CPI database, which publishes updated figures every month.
Steps:
- Follow steps 1–4 above
- Select “Use CPI start & CPI end” as the method
- Enter the CPI index value for your start date (e.g., 258.8 for January 2020)
- Enter the CPI index value for your end date (e.g., 315.1 for early 2026)
- Click Calculate
How to Read Your Results
| Result Field | What It Means |
|---|---|
| Start Amount | Your original dollar figure |
| End Amount | Inflation-adjusted equivalent |
| Cumulative Inflation % | Total price increase over the full period |
| Annual Rate | Average yearly inflation during the period |
| Monthly Rate | Month-by-month compounding rate |
| Purchasing Power Ratio | How much each original dollar is worth now |
Forward vs. Backward Calculation — At a Glance:
| Mode | Use Case | Example |
|---|---|---|
| Forward | What will $1,000 cost in 5 years? | Today → Future |
| Backward | What was $500 in 2010 worth today? | Past → Present |
Real Example: $1,000 in January 2020 at an average 4.5% annual inflation rate equals $1,249 by March 2026 — a $249 real-terms loss if your savings just sat idle.
Use the “Toggle Monthly Schedule” button to see month-by-month value changes, or download the full schedule as a CSV for your own analysis.
Inflation Rate 2026 — What’s Happening to Your Money Right Now
U.S. Inflation Rate 2026 — Live Data Snapshot
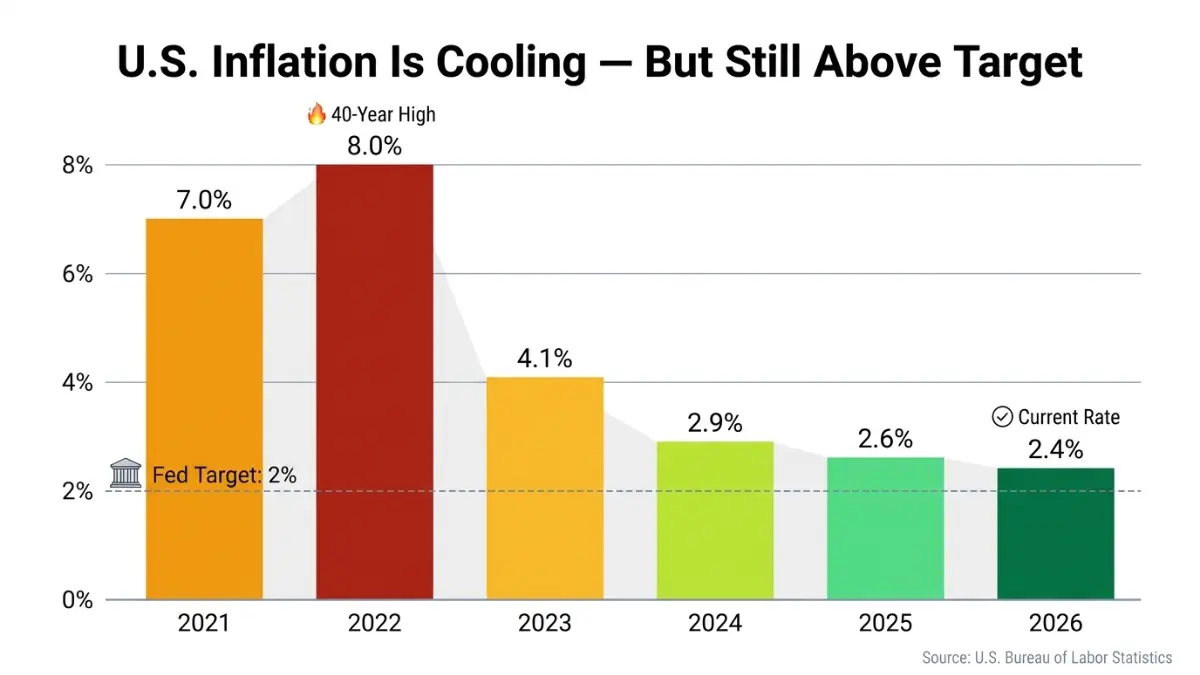
The annual U.S. inflation rate for the 12 months ending February 2026 is 2.4% — confirming a continued slowdown from the post-pandemic peak of 8.0% in 2022, per Bureau of Labor Statistics CPI data.
Historical Inflation Rate Comparison (U.S.):
| Year | Annual Inflation Rate |
|---|---|
| 2021 | 7.0% |
| 2022 | 8.0% (40-year high) |
| 2023 | 4.1% |
| 2024 | 2.9% |
| 2025 | 2.6% (avg) |
| 2026 (YTD) | 2.4% |
The Federal Reserve targets a 2% inflation rate over the long run — a benchmark it maintains to balance price stability with maximum employment. You can read the Fed’s official position on this at federalreserve.gov.
What This Means For Your Purchasing Power
Bold Insight: If you earned $50,000 in 2021 and received no raise since, your salary has the purchasing power of roughly $41,900 in 2021 dollars — you effectively took a $8,100 pay cut without anyone touching your paycheck.
Use our salary calculator alongside the inflation tool above to see the exact real-terms value of your current income.
Sector-by-Sector Breakdown — Where Inflation Hurts Most in 2026
- Healthcare: +3.4% — Rising faster than overall CPI; one of the biggest cost pressures for American families
- Food: +3.1% — Groceries and dining continue to outpace headline inflation
- Airline tickets: +7.1% — Travel costs surging; plan ahead and budget for inflation
- Tuition: +2.0% — College costs remain elevated; use our student loan calculator to plan repayment in real terms
- Energy: Declining — Temporary relief, but historically volatile
How Inflation Is Eroding Your Money — Savings, Salary, Debt & Investments
This is the section every competitor ignores. Understanding the inflation impact on your money isn’t just academic — it changes what you should do with every dollar.
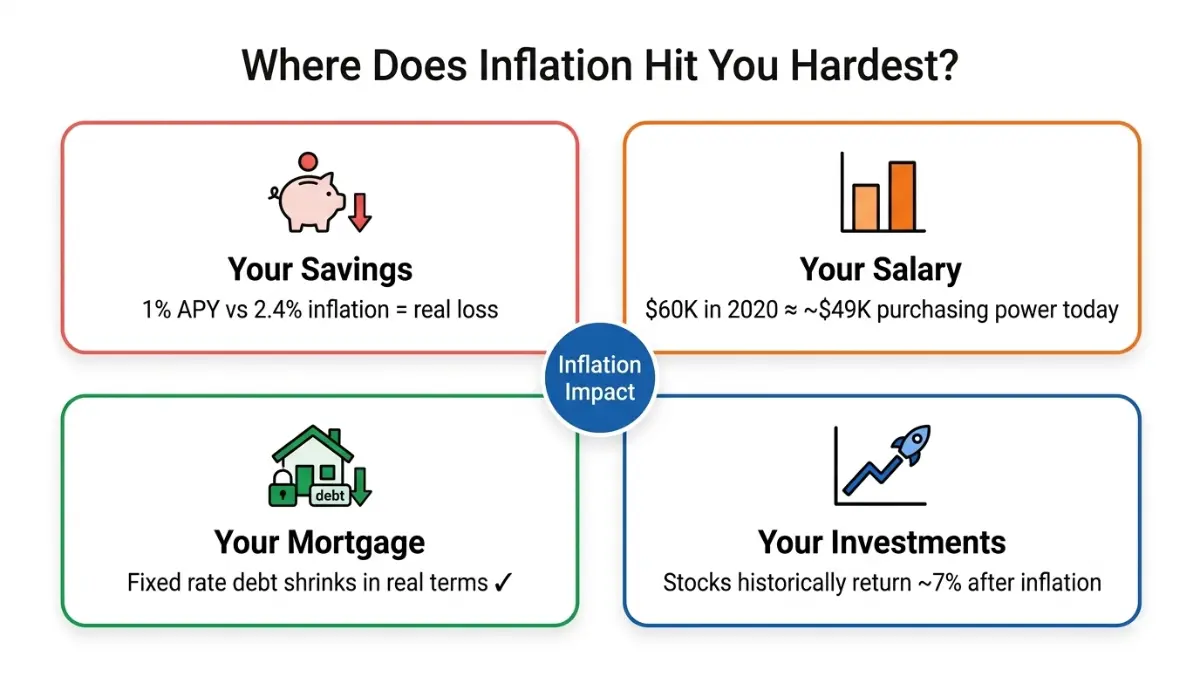
Your Savings Account Is Losing Real Value
If your savings account earns 1.0% APY while inflation runs at 2.4%, you’re losing 1.4% in real purchasing power every year.
Example:
- $10,000 in a 1% savings account → earns $100 in a year
- Inflation at 2.4% erodes $240 in purchasing power
- Net real loss: $140
What to do instead:
- High-yield savings accounts currently offering 4–5% APY
- Series I Savings Bonds from the U.S. Treasury, which adjust with inflation — the current composite rate for I bonds issued through April 2026 is 4.03%, per TreasuryDirect.gov
- Treasury Inflation-Protected Securities (TIPS)
- Consider our CD calculator to compare fixed-rate deposit returns against current inflation
Is Your Salary Keeping Up With Inflation?
This is the most personal use of an inflation rate calculator — and no major competitor explains it.
Real Salary Erosion Example:
| Year | Salary | Inflation-Adjusted Value in 2026 Dollars |
|---|---|---|
| 2020 | $60,000 | ~$75,000 required |
| 2021 | $60,000 | ~$73,200 required |
| 2022 | $60,000 | ~$69,400 required |
| 2023 | $60,000 | ~$67,000 required |
| 2026 | $60,000 | $60,000 (current dollars) |
If your salary hasn’t risen with inflation, you’ve effectively had a pay cut every year since 2020. Use our hourly to salary calculator to track your income in real terms.
Inflation and Your Mortgage — Good News and Bad News
Fixed-rate mortgage holders: Inflation actually works in your favor. Your loan balance stays fixed while the dollar value of that debt decreases in real terms over time. A $300,000 mortgage from 2019 is worth significantly less in 2026 dollars.
Variable-rate mortgage holders: The opposite risk applies — rising rates to combat inflation can increase your monthly payments sharply.
Use our mortgage refinance calculator to model whether switching from variable to fixed makes sense given the current inflation environment. And if you’re carrying high-interest consumer debt, our debt consolidation calculator can help you calculate the real-terms cost of debt over time.
Inflation and Your Investments
- The U.S. stock market has historically returned ~10% annually, or approximately 7% after inflation
- Inflation-beating asset classes include equities, real estate, commodities, and TIPS
- Keeping large amounts in cash guarantees a real-terms loss during any inflationary period
What This Means For You: Every dollar sitting idle in a low-yield account is guaranteed to lose purchasing power. Even modest investing in index funds or inflation-protected bonds can protect your savings. See our investment calculator and compound interest calculator to run inflation-adjusted projections.
How Inflation Is Calculated — The Formula Behind the Numbers
The Inflation Rate Formula
Understanding the math behind your inflation calculator results helps you trust and apply them. Here are the two core formulas:
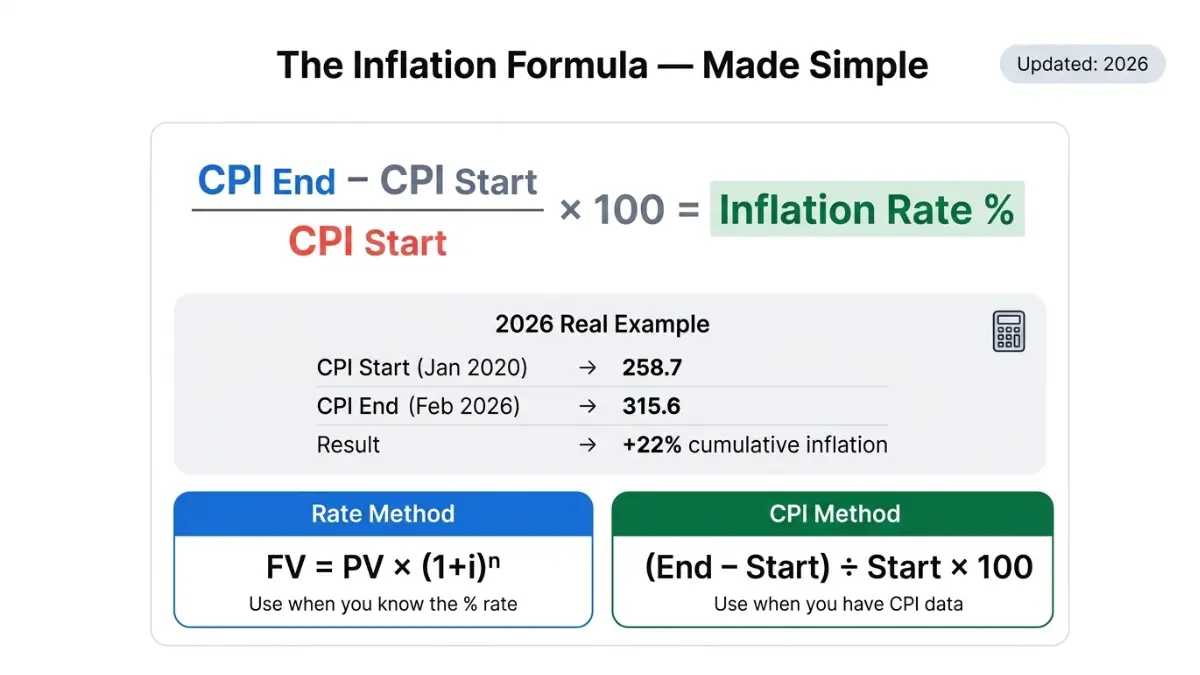
Formula 1 — Inflation Rate Using CPI:
Inflation Rate (%) = (CPI End − CPI Start) ÷ CPI Start × 100
Formula 2 — Future Value Using Compounding:
Future Value = Present Value × (1 + Annual Inflation Rate)^Years
Worked Example Using Real 2026 Data:
- CPI in January 2020: 258.7
- CPI in February 2026: 315.6 (approximate)
- Inflation rate = (315.6 − 258.7) ÷ 258.7 × 100 = 22.0% cumulative inflation
- So $1,000 in January 2020 → $1,220 needed in 2026 to buy the same goods
What Is the Consumer Price Index (CPI)?
The Consumer Price Index (CPI) is a monthly measure published by the U.S. Bureau of Labor Statistics that tracks price changes across a standardized “basket of goods” — including food, housing, transportation, medical care, and education.
What’s in the CPI basket:
- Housing & Shelter (~33% of weight)
- Food & Beverages (~15%)
- Transportation (~15%)
- Medical Care (~8%)
- Education & Communication (~6%)
- Other goods & services (~23%)
Core Inflation vs. Headline Inflation — What’s the Difference?
| Metric | Includes | Best For |
|---|---|---|
| Headline CPI | All items, including food and energy | General cost of living |
| Core CPI | Excludes food and energy | Fed policy decisions |
| PCE Index | Broader spending measure | Federal Reserve’s preferred metric |
The Federal Reserve watches core inflation closely because food and energy prices are highly volatile. As of February 2026, core CPI sits at 2.5% — just above the Fed’s 2% target.
CPI vs. PCE — Which Should You Use?
Most consumers should use CPI — it directly measures what you pay at the store, pharmacy, and gas pump. The PCE index, preferred by the Federal Reserve, is slightly lower and uses a broader methodology. Our inflation calculator defaults to CPI-based calculations, which is the most widely applicable standard for personal finance decisions.
If you’re planning retirement savings around inflation, pair this tool with our retirement calculator and 401(k) calculator to project inflation-adjusted retirement income.
Frequently Asked Questions — Inflation Calculator
Q1. What is an inflation calculator?
An inflation calculator converts a dollar amount from one time period into its equivalent in another period, based on price changes measured by the Consumer Price Index. It shows how much purchasing power has been gained or lost over time.
Q2. What is the U.S. inflation rate in 2026?
As of February 2026, the U.S. annual inflation rate is 2.4%, per the Bureau of Labor Statistics. This is down significantly from the 2022 peak of 8.0% and is approaching the Federal Reserve’s 2% long-term target.
Q3. How do I use a CPI calculator?
– Enter your starting dollar amount
– Choose your start and end dates
– Select the CPI method and enter the CPI values for both dates (available from bls.gov)
– Click Calculate — the tool returns your inflation-adjusted value, cumulative rate, and year-by-year breakdown
Q4. How much has $1,000 lost in value since 2020?
$1,000 in January 2020 has the purchasing power of approximately $820–$830 in 2020 dollars when measured in 2026. In other words, you need roughly $1,200–$1,250 in 2026 to buy what $1,000 bought in early 2020 — a real-terms erosion of 20%+.
Q5. Is my salary keeping up with inflation?
If your wages haven’t risen by at least 22–25% since 2020, your real purchasing power has declined. Enter your 2020 salary into the inflation calculator above and compare it to your current income to see your personal wage-inflation gap. Our salary calculator can also help you run this comparison.
Q6. How does inflation affect purchasing power?
When inflation rises, each dollar buys fewer goods and services. At 2.4% inflation, $100 today buys what $97.65 bought a year ago — a small but compounding effect. Over a decade at that rate, $100 loses roughly 21% of its purchasing power.
Q7. What is a good inflation rate?
The Federal Reserve targets 2% annual inflation as the ideal benchmark. At 2%, prices rise slowly enough that consumers keep spending (not hoarding cash) while wages and savings can realistically outpace price increases.
Q8. How does inflation affect a mortgage?
For fixed-rate mortgages, inflation helps borrowers — the real value of the debt shrinks over time. A $400,000 mortgage feels “smaller” in inflated future dollars. For variable-rate loans, rising inflation typically triggers rate hikes that increase monthly payments. Use our mortgage calculator to model both scenarios.
Q9. Can I calculate inflation for UK, Canada, or Australia?
Yes. Our inflation calculator supports 22 currencies including GBP (British Pound), CAD (Canadian Dollar), and AUD (Australian Dollar). Simply select your currency from the dropdown before entering your amount and dates. This makes it one of the few free tools that serves Tier 1 global markets beyond the U.S.
Q10. What is cumulative inflation rate?
Cumulative inflation is the total percentage increase in prices over an entire period — not just one year. For example, from 2020 to 2026, cumulative U.S. inflation is approximately 22–25%. Our calculator displays this figure directly in the results panel labeled “Cumulative Inflation.”
Q11. How is future inflation predicted?
Future inflation projections are based on three primary sources: (1) the Congressional Budget Office (CBO) forecasts based on fiscal policy modeling, (2) the Federal Reserve’s dot plot projections from FOMC meetings, and (3) historical average rates — the long-run U.S. average since 1913 is approximately 3.27% per year. Our calculator lets you enter any custom rate for future projections.
⚠️ Disclaimer: This article and the inflation calculator tool are provided for educational and informational purposes only. The results generated are estimates based on the inputs provided and do not constitute financial, investment, or tax advice. Inflation rates are historical and subject to change. Always consult a qualified financial advisor before making investment, savings, or retirement planning decisions.
Last updated: March 2026 | Data source: U.S. Bureau of Labor Statistics | Expert review: Finance Authority Hub Editorial Panel
Informational disclaimer
The content on Finance Authority Hub is provided for general informational and educational purposes only and should not be considered personalized financial, investment, tax, legal, or professional advice. Financial decisions depend on your individual goals, income, risk tolerance, location, and regulatory situation. Before acting on any information, strategy, estimate, or calculator result, consult a qualified licensed professional who can evaluate your specific circumstances.