Hourly to Salary Calculator (2026 Tax Results)
Hourly to Salary Calculator
Convert hourly pay into salary equivalents across all pay periods, add overtime + extras, and see paid-hours vs worked-hours insights (PTO/holidays/unpaid leave).
Inputs
All extras are converted to annual + monthly equivalents for comparison.
Results
Equivalent salary (gross annual)
—
As of: —
Gross monthly
—
Gross weekly: —
Adjusted hourly rate
—
Base hourly: —
Net monthly (optional)
—
Estimated annual tax: —
Hours & leave (your real “salary math”)
Hours/week: —
Scheduled hours/year: —
Paid hours/year: —
Worked hours/year: —
Paid leave hours: —
Unpaid leave hours: —
2080-hour reference (40×52)
Reference annual: — • Difference vs your schedule: —
This helps compare your custom schedule against the common full-time “2,080 hours/year” baseline.
Pay-period conversions (gross)
| Period | Amount |
|---|
Annual breakdown (what builds your “salary”)
| Component | Annual | % of gross | Notes |
|---|
Extra earnings detail
| Item | Frequency | Monthly equiv | Annual |
|---|
Results appear after you click “Calculate.”
In This Article
Use the hourly to salary calculator above to instantly convert your hourly wage to annual, monthly, biweekly, and weekly pay — including overtime, bonuses, PTO adjustments, and 2026 after-tax estimates.
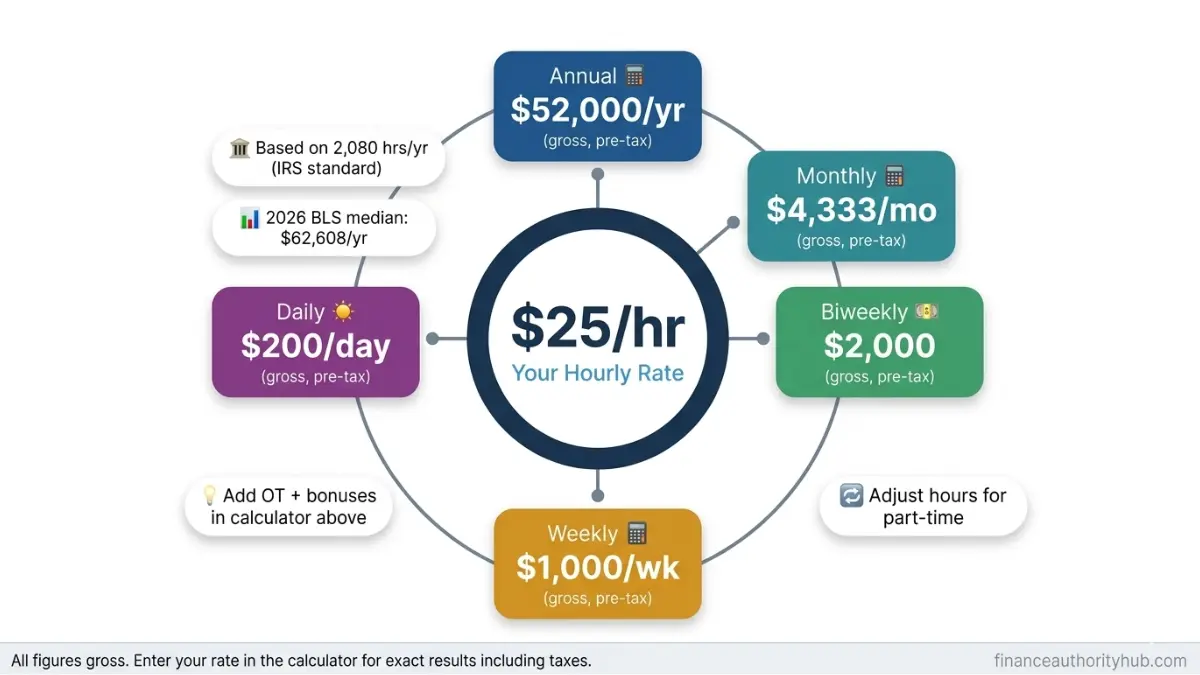
Quick answer: $25/hour = $52,000/year (40 hrs/week × 52 weeks). But your real number depends on overtime, paid leave, shift differentials, and where you live. Enter your details in the calculator above — it handles all of it.
What this calculator does that others don’t:
- Calculates overtime pay using your actual multiplier (default 1.5×)
- Subtracts unpaid leave days from your real paid hours
- Adds bonuses and commissions to your annual total
- Applies shift differential (percent or flat amount per hour)
- Shows gross vs. estimated net after 2026 federal tax
How to Convert Hourly Wage to Annual Salary (The Right Way)
The Standard Formula — And Why It’s Not Enough
Most people use one formula:
Annual Salary = Hourly Rate × Hours per Week × Weeks per Year
That gives you a fast number. But it’s not your real annual salary equivalent — especially if you have overtime, bonuses, or take unpaid time off.
Example: $25/hour × 40 hours × 52 weeks = $52,000/year gross. But if you work 5 hours of overtime weekly at 1.5×, your real annual income is closer to $61,750.
The 2,080-Hour Baseline Explained
The standard “full-time year” used by the IRS, the Bureau of Labor Statistics, and most employers is 2,080 hours (40 hours × 52 weeks).
Why this matters:
- Job offers and salary comparisons almost always use the 2,080-hour base
- If you work fewer hours (part-time, unpaid leave), your real annual income is lower
- The calculator above shows the exact difference between your schedule and the 2,080-hour reference
Key takeaway: Always compare hourly to salary conversion using your actual paid hours — not just the standard 2,080.
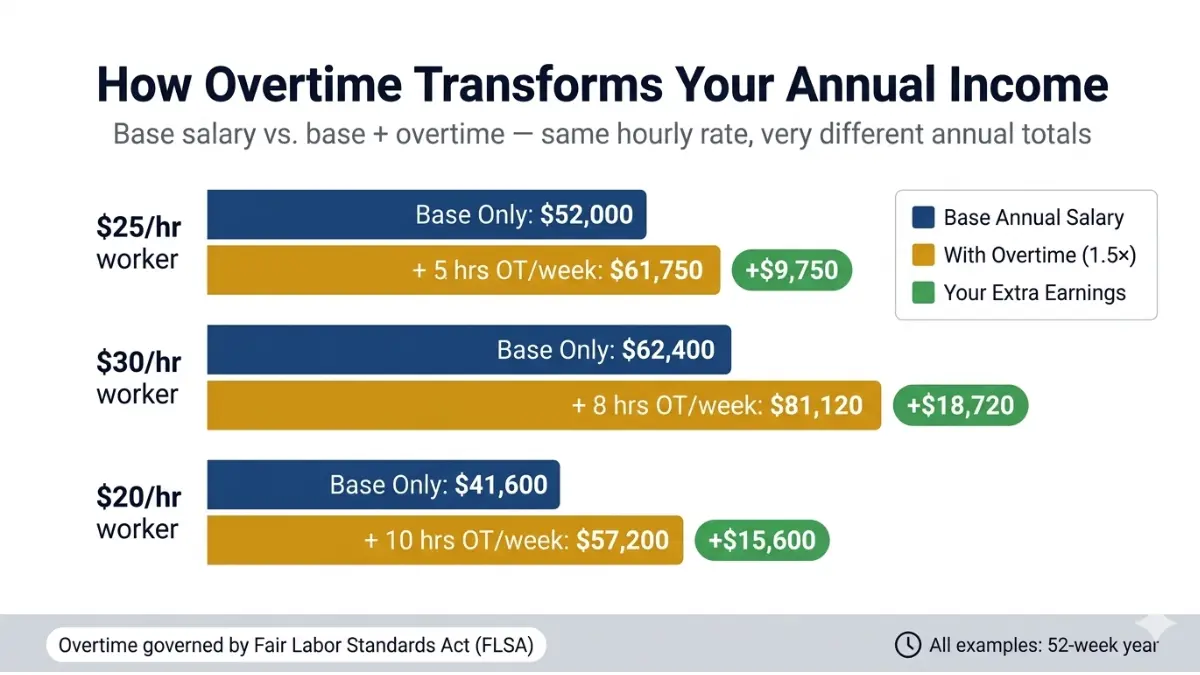
How Overtime Changes Your Annual Income
Overtime pay is calculated separately from your base hourly rate. Under the Fair Labor Standards Act (FLSA), non-exempt employees earn at least 1.5× their regular rate for all hours over 40/week.
Real overtime example:
| Scenario | Calculation | Annual Impact |
|---|---|---|
| $25/hr, 5 OT hrs/week | $25 × 1.5 × 5 × 52 | +$9,750/year |
| $30/hr, 8 OT hrs/week | $30 × 1.5 × 8 × 52 | +$18,720/year |
| $20/hr, 10 OT hrs/week | $20 × 1.5 × 10 × 52 | +$15,600/year |
Enter your overtime hours and multiplier directly in the calculator’s overtime fields to get your accurate hourly to yearly salary figure.
Quick Reference: Hourly to Annual Salary (Standard 40 hrs/52 wks)
| Hourly Rate | Annual Gross | Monthly | Biweekly | Weekly |
|---|---|---|---|---|
| $10/hr | $20,800 | $1,733 | $800 | $400 |
| $15/hr | $31,200 | $2,600 | $1,200 | $600 |
| $20/hr | $41,600 | $3,467 | $1,600 | $800 |
| $25/hr | $52,000 | $4,333 | $2,000 | $1,000 |
| $30/hr | $62,400 | $5,200 | $2,400 | $1,200 |
| $35/hr | $72,800 | $6,067 | $2,800 | $1,400 |
| $40/hr | $83,200 | $6,933 | $3,200 | $1,600 |
| $50/hr | $104,000 | $8,667 | $4,000 | $2,000 |
All figures are gross, pre-tax, based on 2,080 hours/year.
Once you know your annual salary, use our debt-to-income ratio calculator to see what percentage of your income goes to debt payments — a critical number for loan approvals.
2026 Federal Tax Results — What You Actually Take Home
2026 Federal Income Tax Brackets (Official, Updated)
For tax year 2026, the standard deduction rises to $16,100 for single filers — an increase from 2025 — and the seven tax rates (10%, 12%, 22%, 24%, 32%, 35%, 37%) remain in place as permanently extended.
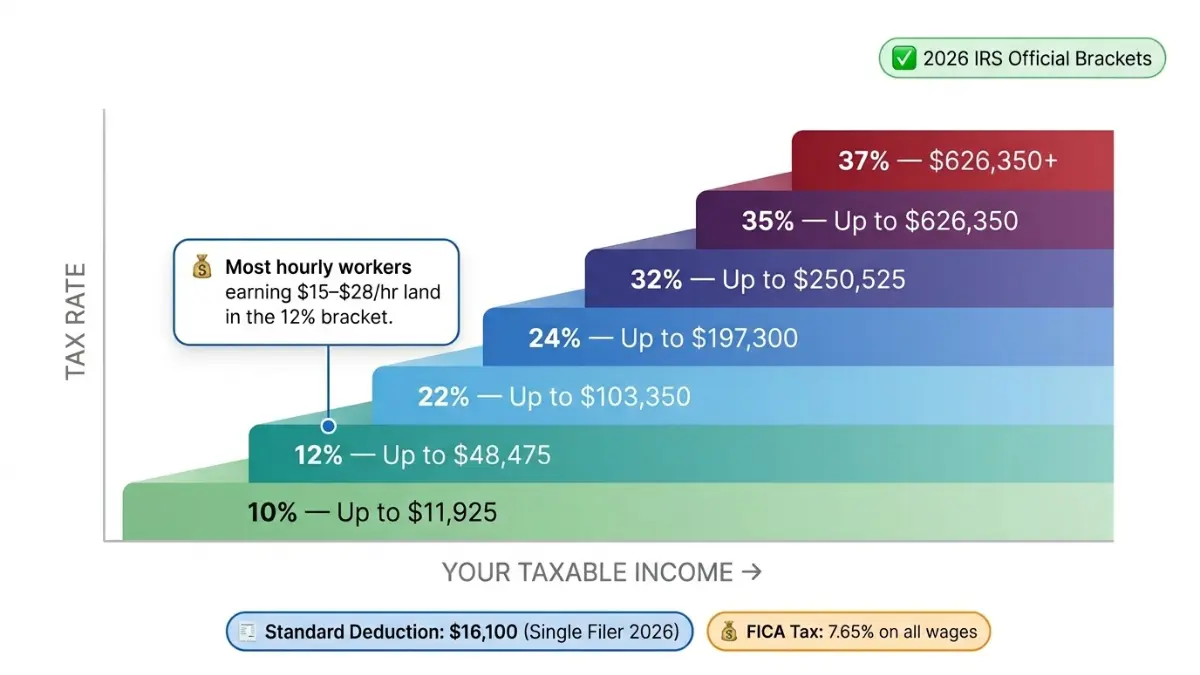
2026 Federal Tax Brackets — Single Filer
| Tax Rate | Taxable Income Range |
|---|---|
| 10% | $0 – $11,925 |
| 12% | $11,926 – $48,475 |
| 22% | $48,476 – $103,350 |
| 24% | $103,351 – $197,300 |
| 32% | $197,301 – $250,525 |
| 35% | $250,526 – $626,350 |
| 37% | Over $626,350 |
Source: IRS Revenue Procedure 2025-32
Important: Tax brackets apply to taxable income after your standard deduction of $16,100 (single filer, 2026). A $52,000 gross annual salary has taxable income of $35,900 — landing squarely in the 12% bracket.
FICA Taxes in 2026 — Social Security and Medicare
For 2026, the Social Security tax rate is 6.2% for both employee and employer, with a wage base limit of $184,500. The Medicare tax rate is 1.45% each for employee and employer, with no wage cap.
What this means for you:
- On a $52,000 salary: FICA = $52,000 × 7.65% = $3,978/year
- High earners above $200,000 pay an additional 0.9% Medicare tax
- Your employer matches your FICA contribution — it’s not included in your paycheck deduction
Real After-Tax Take-Home: Common Hourly Rates (2026)
| Hourly | Gross Annual | Federal Tax Est. | FICA | Est. Net Annual | Est. Net Monthly |
|---|---|---|---|---|---|
| $15/hr | $31,200 | $1,811 | $2,387 | $27,002 | $2,250 |
| $20/hr | $41,600 | $3,179 | $3,182 | $35,239 | $2,937 |
| $25/hr | $52,000 | $4,547 | $3,978 | $43,475 | $3,623 |
| $30/hr | $62,400 | $6,395 | $4,774 | $51,231 | $4,269 |
| $40/hr | $83,200 | $11,431 | $6,365 | $65,404 | $5,450 |
| $50/hr | $104,000 | $17,519 | $7,956 | $78,525 | $6,544 |
Single filer, standard deduction $16,100, 2026 brackets. Does not include state income tax.
9 States With Zero State Income Tax in 2026
Living in a no-income-tax state can add $1,500–$6,000+ to your annual take-home pay:
Alaska, Florida, Nevada, New Hampshire, South Dakota, Tennessee, Texas, Washington, Wyoming
If you earn $52,000/year in California (≈6% state tax), you pay roughly $3,120 more in state taxes than someone earning the same wage in Texas or Florida. That’s the equivalent of $1.50/hour simply from where you live.
Overtime, Bonuses, Shift Differential, and PTO — Your Real Salary Equivalent
Overtime Pay: FLSA 2026 Rules
Most hourly workers are non-exempt under the FLSA, meaning overtime protections apply. The federal overtime threshold for exempt employees (salaried, no OT required) is $58,656/year ($1,128/week) as of 2024 — with potential 2026 adjustments pending.
What this means for hourly workers:
- All hours over 40/week must be paid at minimum 1.5× your base rate
- Some states (California, Colorado) require daily overtime after 8 hours
- Double-time (2×) applies in some states for hours over 12/day
Real nurse example: A hospital RN earning $34/hr works 8 hours of overtime every week.
- Overtime annual = $34 × 1.5 × 8 hrs × 52 weeks = +$21,216/year
- Total annual salary equivalent: $34 × 2,080 + $21,216 = $91,936/year
The calculator’s overtime fields handle this automatically — enter your OT hours/week and your multiplier.
Adding Bonuses and Commissions to Your Annual Income
Most hourly wage calculators ignore bonuses entirely. Ours doesn’t. Use the “Add Extra Earning” feature to include:
- Annual performance bonus
- Quarterly commission
- Signing bonus (use “one-time” frequency)
- Monthly car or cell phone allowance
Example: $25/hr base + $4,000 annual bonus + $200/month car allowance = $58,400 total annual compensation vs. $52,000 base. That’s a 12.3% difference — critical when comparing job offers.
PTO and Unpaid Leave: The Hidden Salary Impact
This is the biggest gap all competitors miss.
Here’s the math most people get wrong:
Paid time off (PTO and holidays) is already baked into your salary — you’re paid for those hours whether you work or not. But unpaid leave directly reduces your paid hours and your real annual income.
| Schedule | Paid Hours | Annual Gross ($25/hr) |
|---|---|---|
| 0 unpaid days | 2,080 | $52,000 |
| 5 unpaid days (40 hrs) | 2,040 | $51,000 (-$1,000) |
| 10 unpaid days (80 hrs) | 2,000 | $50,000 (-$2,000) |
| 20 unpaid days (160 hrs) | 1,920 | $48,000 (-$4,000) |
The calculator’s “Unpaid days/year” field adjusts your paid hours automatically. This is the only hourly to salary calculator that shows you this breakdown with this level of precision.
If you’re planning to pay down debt with your annual income, try our debt consolidation calculator to see how salary changes affect your payoff timeline.
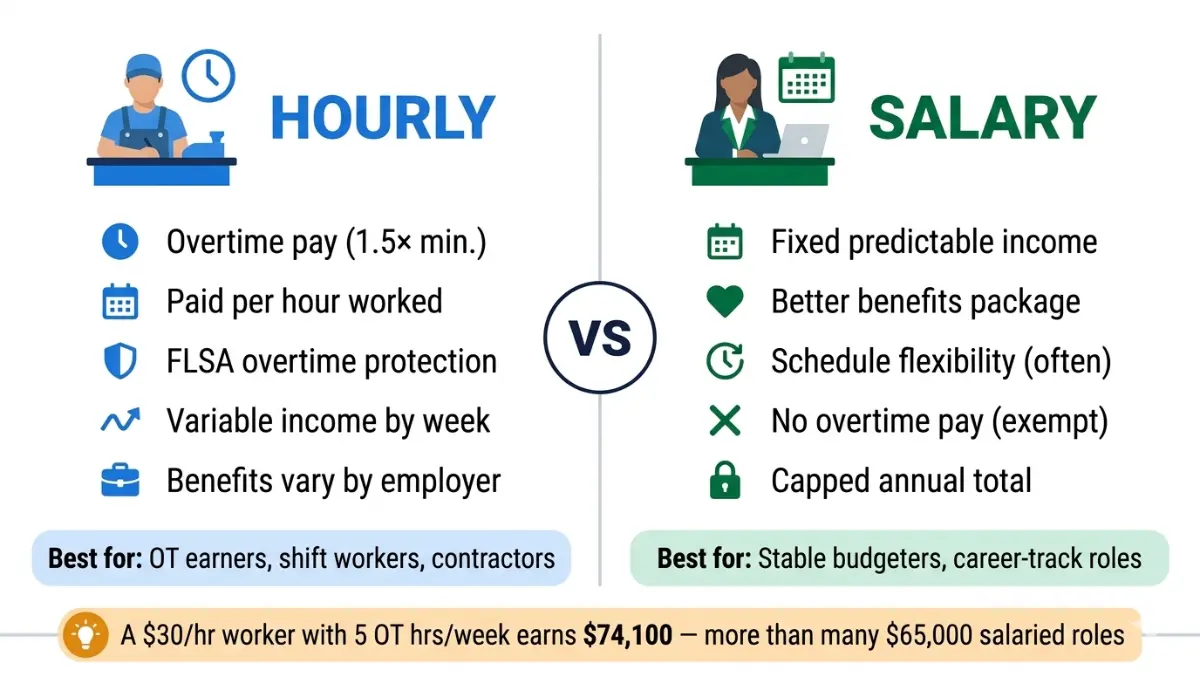
Hourly vs. Salaried — Which Pay Structure Wins in 2026?
Side-by-Side Comparison
| Feature | Hourly Pay | Salaried Pay |
|---|---|---|
| Overtime eligibility | ✅ Yes (FLSA non-exempt) | ❌ Usually no (exempt) |
| Income predictability | Variable (hours-based) | Fixed per pay period |
| Pay for extra hours | Yes (1.5× minimum) | Rarely |
| Benefits access | Varies by employer | Often more comprehensive |
| Schedule flexibility | Often rigid shifts | Sometimes more flexible |
| Tax withholding | Same rates as salary | Same rates as hourly |
When Hourly Pay Earns MORE Than Salary
A common assumption is that salaried workers earn more. That’s often wrong.
Real comparison:
- Salaried position: $65,000/year, no overtime
- Hourly position: $30/hr, average 5 OT hours/week
- Hourly annual: $30 × 2,080 + ($30 × 1.5 × 5 × 52) = $62,400 + $11,700 = $74,100
The hourly worker earns $9,100 more annually — purely from overtime eligibility.
According to the Bureau of Labor Statistics, median weekly earnings of full-time U.S. workers were $1,204 in 2025, equating to approximately $62,608 per year — providing a useful benchmark when evaluating whether a new hourly rate converts to a competitive annual salary.
The Freelancer Salary Equivalent Formula
If you’re self-employed or a 1099 contractor, your hourly-to-salary conversion must account for:
- Self-employment tax: 15.3% on net earnings (vs. 7.65% for employees)
- No employer-paid benefits: Health insurance, retirement match, PTO — you fund these yourself
- Estimated tax payments: Quarterly deposits to the IRS
Rule of thumb: To match a $60,000 salaried employee’s total compensation, a freelancer typically needs $75,000–$82,000 in gross annual revenue.
To model your savings once you’ve locked in your salary equivalent, run the numbers through our compound interest calculator — small monthly contributions build into life-changing wealth over time.
Hourly to Annual Salary Chart — Full 2026 Reference Table
Standard full-time schedule: 40 hrs/week, 52 weeks/year (2,080 hours)
| Hourly Rate | Annual Gross | Monthly | Biweekly | Weekly | Est. Net Annual* |
|---|---|---|---|---|---|
| $10/hr | $20,800 | $1,733 | $800 | $400 | $18,657 |
| $12/hr | $24,960 | $2,080 | $960 | $480 | $22,029 |
| $15/hr | $31,200 | $2,600 | $1,200 | $600 | $27,002 |
| $17/hr | $35,360 | $2,947 | $1,360 | $680 | $30,247 |
| $20/hr | $41,600 | $3,467 | $1,600 | $800 | $35,239 |
| $22/hr | $45,760 | $3,813 | $1,760 | $880 | $38,529 |
| $25/hr | $52,000 | $4,333 | $2,000 | $1,000 | $43,475 |
| $28/hr | $58,240 | $4,853 | $2,240 | $1,120 | $48,317 |
| $30/hr | $62,400 | $5,200 | $2,400 | $1,200 | $51,231 |
| $35/hr | $72,800 | $6,067 | $2,800 | $1,400 | $58,761 |
| $40/hr | $83,200 | $6,933 | $3,200 | $1,600 | $65,404 |
| $45/hr | $93,600 | $7,800 | $3,600 | $1,800 | $71,384 |
| $50/hr | $104,000 | $8,667 | $4,000 | $2,000 | $78,525 |
| $60/hr | $124,800 | $10,400 | $4,800 | $2,400 | $91,452 |
| $75/hr | $156,000 | $13,000 | $6,000 | $3,000 | $109,500 |
| $100/hr | $208,000 | $17,333 | $8,000 | $4,000 | $141,000 |
Est. Net = after 2026 federal income tax + FICA. Single filer, standard deduction $16,100. State taxes not included. Bold rows = most searched rates.
Use the hourly to salary calculator above for any hourly rate not listed here, including custom hours, overtime, and bonuses.
Wondering what your annual salary qualifies for on a home purchase? Our home affordability calculator gives you an instant answer based on your gross income and debts. And if you’re planning retirement contributions from your salary, our 401(k) calculator shows exactly how much to contribute to maximize your employer match.
FAQs — Hourly to Salary Calculator
1. How do I convert hourly rate to annual salary?
Multiply your hourly rate by the hours you work per week, then by the weeks you work per year. The standard formula is: Hourly Rate × 40 hours × 52 weeks = Annual Salary. Use the calculator above to add overtime, bonuses, and PTO for a more accurate result.
2. What is $25 an hour as a yearly salary?
$25/hour = $52,000/year on a standard 40-hour, 52-week schedule. Monthly, that’s $4,333 gross. After 2026 federal taxes and FICA (single filer), estimated take-home is approximately $43,475/year or $3,623/month.
3. How many hours a year is full-time?
A standard full-time schedule is 2,080 hours per year (40 hours/week × 52 weeks). This is the baseline used by the IRS, the Bureau of Labor Statistics, and most employers for salary calculations.
4. Does the hourly to salary calculator include taxes?
Yes. Enter your effective tax rate percentage in the optional tax field, and the calculator shows estimated net monthly and annual take-home pay. The reference table in Section 5 uses 2026 federal brackets and FICA rates for estimates.
5. How do I calculate overtime in my annual salary?
Use this formula: OT Pay = Hourly Rate × 1.5 × OT Hours/Week × 52. Add this to your base annual salary. Our calculator does this automatically — just enter your weekly overtime hours and multiplier in the input fields.
6. What is the federal minimum wage in 2026?
The federal minimum wage remains $7.25/hour as of 2026 — unchanged since 2009. Many states have higher minimums: Washington state leads at $16.66/hour, California at $16.50/hour, and New York at $16.00/hour.
7. How does PTO affect my annual salary calculation?
Paid PTO is already included in your annual salary — you’re paid for those days whether you work or not. Unpaid leave reduces your paid hours. For example, 10 unpaid days at $25/hr costs you $2,000 in annual income. The calculator’s “Unpaid days/year” field adjusts for this automatically.
8. Is $20 an hour a good wage in 2026?
$20/hour equals $41,600/year gross. The median weekly earnings for full-time U.S. workers in 2025 were $1,204 — approximately $62,608 annually — meaning $20/hr is below the national median. In lower cost-of-living states, $20/hr is livable. In high-cost cities like San Francisco or New York, it’s below a comfortable living wage. Use the savings calculator to plan how much you can realistically set aside at this wage.
9. How do I convert hourly to salary for part-time work?
Use your actual hours per week instead of 40. Example: 25 hours/week at $20/hr = $20 × 25 × 52 = $26,000/year. Enter your exact hours/week in the calculator to get an accurate part-time annual salary equivalent.
10. What is the difference between gross and net salary?
Gross salary is your total income before any deductions. Net salary (take-home pay) is what’s left after federal income tax, FICA taxes, state taxes, and any pre-tax benefit deductions. For most workers, net pay is 18–28% lower than gross — the exact gap depends on your income level and state.
11. How do freelancers calculate their salary equivalent?
Freelancers pay 15.3% self-employment tax (both halves of FICA), fund their own benefits, and cover business expenses. To match a $60,000 employee’s total compensation, you typically need $75,000–$82,000 in freelance revenue. Use our ROI calculator to evaluate whether a freelance rate truly outperforms a salaried offer after taxes and costs.
⚠️ Disclaimer: This calculator and all content on this page are for educational and informational purposes only. Results are estimates and do not constitute financial, tax, or legal advice. Tax figures are based on 2026 IRS brackets for a single filer using the standard deduction ($16,100) and do not include state income taxes, local taxes, or pre-tax benefit deductions. Individual results will vary. Always consult a qualified CPA, financial advisor, or tax professional for advice specific to your situation.
Authors


Informational disclaimer
The content on Finance Authority Hub is provided for general informational and educational purposes only and should not be considered personalized financial, investment, tax, legal, or professional advice. Financial decisions depend on your individual goals, income, risk tolerance, location, and regulatory situation. Before acting on any information, strategy, estimate, or calculator result, consult a qualified licensed professional who can evaluate your specific circumstances.