Salary Calculator: Hourly, Weekly & Annual Pay (2026)
Salary Calculator
Convert hourly/daily/weekly/monthly/annual pay, add overtime and bonuses, estimate taxes with an effective rate, and see full gross vs net breakdowns.
Inputs
Mark items as taxable/non-taxable for a better net estimate.
Pre-tax deductions reduce taxable income in this estimator; tax rules vary by country and employer.
Results
Net pay (monthly)
—
Take-home rate: —
As of: —
Gross pay (annual)
—
Base + overtime + extras
Net pay (annual)
—
Taxes + deductions removed
Tax & deductions
Taxable income: —
Estimated taxes: — (Eff: —)
Pre-tax: — • Post-tax: —
Total deducted: —
Work-time & rate insights
Hours/week: —
Hours/year: —
Work days/year: —
Gross hourly: —
Net hourly: —
Overtime (annual): —
Extras (annual): —
Savings goal (monthly): —
Left to spend (monthly): —
Gross vs net conversions
| Period | Gross | Net | Periods/year (assumed) |
|---|
Earnings breakdown (what creates gross pay)
| Component | Monthly equiv | Annual | % of gross | Notes |
|---|
Deductions breakdown (what reduces take-home pay)
| Deduction | Monthly equiv | Annual | % of gross | Notes |
|---|
Results appear after you click “Calculate.”
In This Article
What Is a Salary Calculator — and Why Your Gross Pay Is a Lie
A salary calculator converts your hourly, weekly, or annual pay into a complete gross vs. net pay breakdown — showing exactly what lands in your bank account after taxes and deductions.
Most workers focus on gross salary. That’s a costly mistake.
According to the U.S. Bureau of Labor Statistics, the median full-time worker in America earned $1,204 per week in 2025 — but after federal taxes, FICA, and deductions, the actual take-home is significantly lower. Knowing the difference is the foundation of every smart financial decision you’ll make in 2026.
What our salary calculator does that competitors don’t:
- Converts 7 pay types — hourly, daily, weekly, bi-weekly, semi-monthly, monthly, and annual — in one click
- Models overtime pay with a custom multiplier
- Stacks bonuses, commissions, and allowances on top of base pay
- Calculates both pre-tax and post-tax deductions (401k, health insurance, Roth contributions)
- Includes a savings goal feature showing monthly savings vs. spending
- Supports 22 currencies — USD, GBP, EUR, CAD, AUD, INR, and more
- Exports a full CSV report for your records
Use our full suite of financial tools to take your salary planning further — from budgeting to retirement.
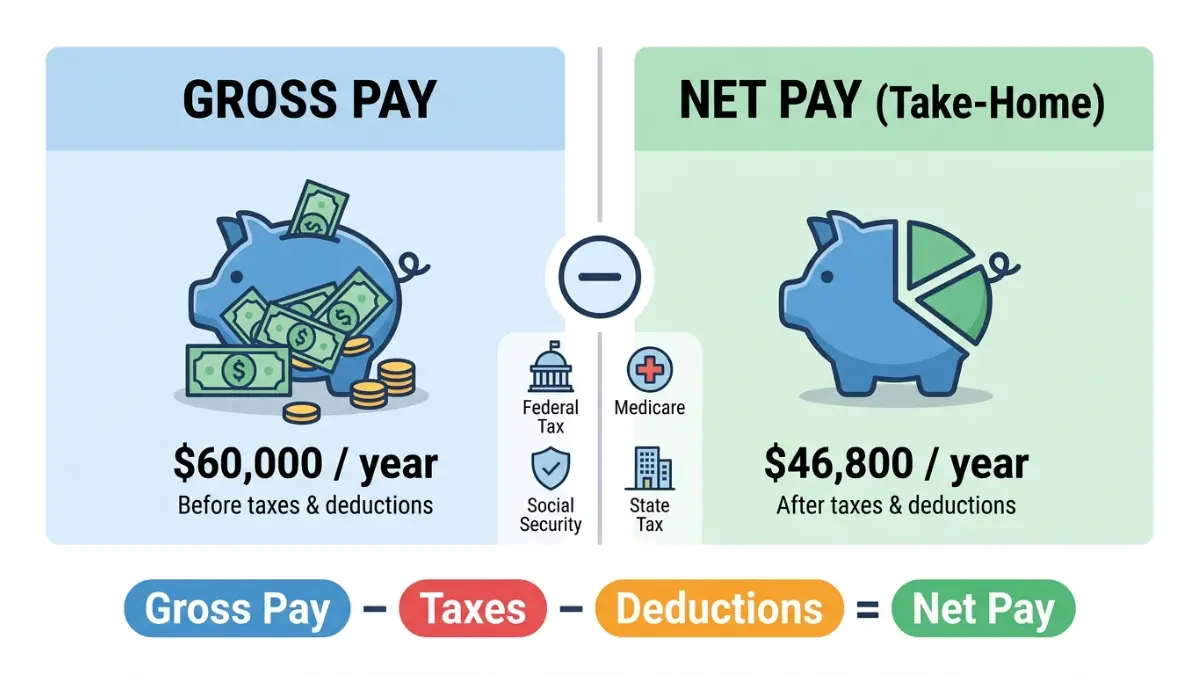
What Is the Difference Between Gross Pay and Net Pay?
Gross pay is what your employer agrees to pay you. Net pay — also called take-home pay — is what you actually receive after all taxes and deductions are removed.
The formula is simple:
Gross Pay – Taxes – Deductions = Net Pay (Take-Home)
Most people are surprised by how large the gap is. Here’s a real 2026 example:
| Pay Type | Gross | Est. Net (22% eff. rate) |
|---|---|---|
| Annual | $60,000 | $46,800 |
| Monthly | $5,000 | $3,900 |
| Bi-weekly | $2,308 | $1,800 |
| Weekly | $1,154 | $900 |
| Hourly (40hr) | $28.85 | $22.50 |
Estimate assumes ~22% blended effective rate. Actual net varies by state, filing status, and deductions.
What Deductions Come Out of Your Paycheck?
Every paycheck has two categories of deductions: mandatory and voluntary.
Mandatory deductions (you cannot opt out):
- Federal income tax — based on your W-4 filing status and 2026 tax brackets (10%–37%)
- Social Security — 6.2% of gross pay, up to a wage cap of $184,500 in 2026 (IRS confirmed)
- Medicare — 1.45% with no cap; earners above $200,000 pay an extra 0.9%
- State income tax — ranges from 0% (Texas, Florida, Nevada) to 13%+ (California)
Voluntary / pre-tax deductions (reduce your taxable income):
- 401(k) contributions
- Health insurance premiums
- Health Savings Account (HSA) contributions
- Flexible Spending Account (FSA) — limit is $3,400 in 2026
Post-tax deductions (taken after taxes):
- Roth 401(k) contributions
- Wage garnishments
- Union dues
Understanding how HSA contributions interact with your tax bracket is one of the most underused salary optimization strategies for 2026.
What Is an Effective Tax Rate?
Your effective tax rate is the average rate you pay across all your income — not the top rate. A single filer earning $60,000 in 2026 doesn’t pay 22% on everything. According to the IRS 2026 tax tables, they pay 10% on the first $12,400, 12% up to $50,400, and 22% on the rest — yielding an effective rate closer to 14–16%.
How to Use the Salary Calculator (Step-by-Step)
This salary calculator handles every pay structure — whether you’re an hourly worker, a salaried employee, a freelancer, or a contractor. Here’s exactly how to use it:
Step 1: Select your currency (22 options including USD, GBP, EUR, CAD, AUD, INR)
Step 2: Choose your base pay type
- Hourly | Daily | Weekly | Bi-weekly | Semi-monthly | Monthly | Annual
Step 3: Enter your base pay amount
- Example: $25 for hourly, or $60,000 for annual salary
Step 4: Set your hours per day, days per week, and weeks per year
- Defaults: 8 hrs/day | 5 days/week | 52 weeks/year
Step 5: Add overtime (optional)
- Enter overtime hours per week + multiplier (default: 1.5×)
Step 6: Enter your effective tax rate % (optional)
- Not sure? Use the IRS Tax Withholding Estimator for a fast estimate
Step 7: Add extra earnings (optional)
- Bonuses, commissions, allowances — mark each as taxable or non-taxable
Step 8: Add deductions (optional)
- Retirement contributions, health insurance — mark each as pre-tax or post-tax
Step 9: Set a savings goal % of net pay
- Example: 20% — the calculator shows your monthly savings target and remaining spending money
Step 10: Click Calculate — then download your full CSV report

What Results Will You See?
After clicking Calculate, you get:
- Net monthly pay + take-home rate percentage
- Gross annual (base + overtime + bonuses combined)
- Full conversion table — hourly, daily, weekly, bi-weekly, semi-monthly, monthly, annual
- Earnings breakdown — what percent each component contributes to gross
- Deductions breakdown — taxes, pre-tax, and post-tax items
- Savings goal — monthly savings vs. monthly spending
What This Means For You: If you earn $25/hour working 40 hours per week, your gross annual salary is $52,000. After a ~20% effective tax rate and typical deductions, your estimated take-home is roughly $39,000–$41,000 per year — or about $3,250–$3,420 per month. Always base your budget on net, not gross.
Once you know your real take-home, use our Mortgage Calculator to see what monthly payment your net income can actually support — most lenders use gross income for approvals, but you’ll live on your net.
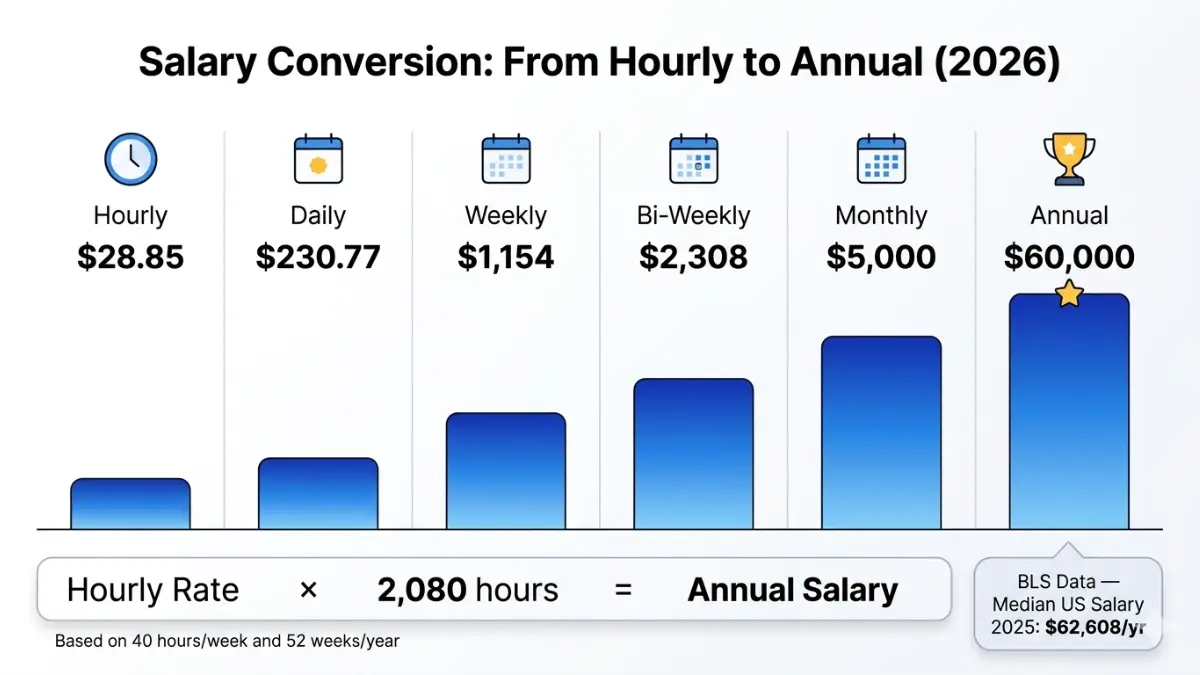
Salary Conversion Table: Hourly, Weekly, Monthly & Annual Pay (2026)
Job offers come in all formats — hourly, monthly, or annual. Use this reference table to instantly convert and compare.
Formula: Annual Salary ÷ 2,080 hours = Hourly Rate | Hourly Rate × 2,080 = Annual Salary
| Annual Salary | Monthly | Bi-Weekly | Weekly | Hourly (40hr/52wk) |
|---|---|---|---|---|
| $30,000 | $2,500 | $1,154 | $577 | $14.42 |
| $40,000 | $3,333 | $1,538 | $769 | $19.23 |
| $50,000 | $4,167 | $1,923 | $962 | $24.04 |
| $60,000 | $5,000 | $2,308 | $1,154 | $28.85 |
| $75,000 | $6,250 | $2,885 | $1,442 | $36.06 |
| $100,000 | $8,333 | $3,846 | $1,923 | $48.08 |
| $120,000 | $10,000 | $4,615 | $2,308 | $57.69 |
| $150,000 | $12,500 | $5,769 | $2,885 | $72.12 |
How to Convert Hourly to Annual Salary
Hourly Rate × 40 hours × 52 weeks = Annual Salary
Example: $22/hour × 40 × 52 = $45,760 annual gross
How to Convert Annual Salary to Hourly Rate
Annual Salary ÷ 2,080 hours = Hourly Rate
Example: $65,000 ÷ 2,080 = $31.25/hour
What Is the Average US Salary in 2026?
According to the Bureau of Labor Statistics, full-time workers in the US had a median weekly earnings figure of $1,204 in 2025, which translates to approximately $62,608 per year. This figure is the real-world benchmark for comparing your salary against the national median.
What This Means For You: If your annual salary is below $62,608, you’re earning below the national median for full-time workers. If you’re evaluating a new job offer, always use our Home Affordability Calculator to see how the offer translates to real purchasing power in your city.
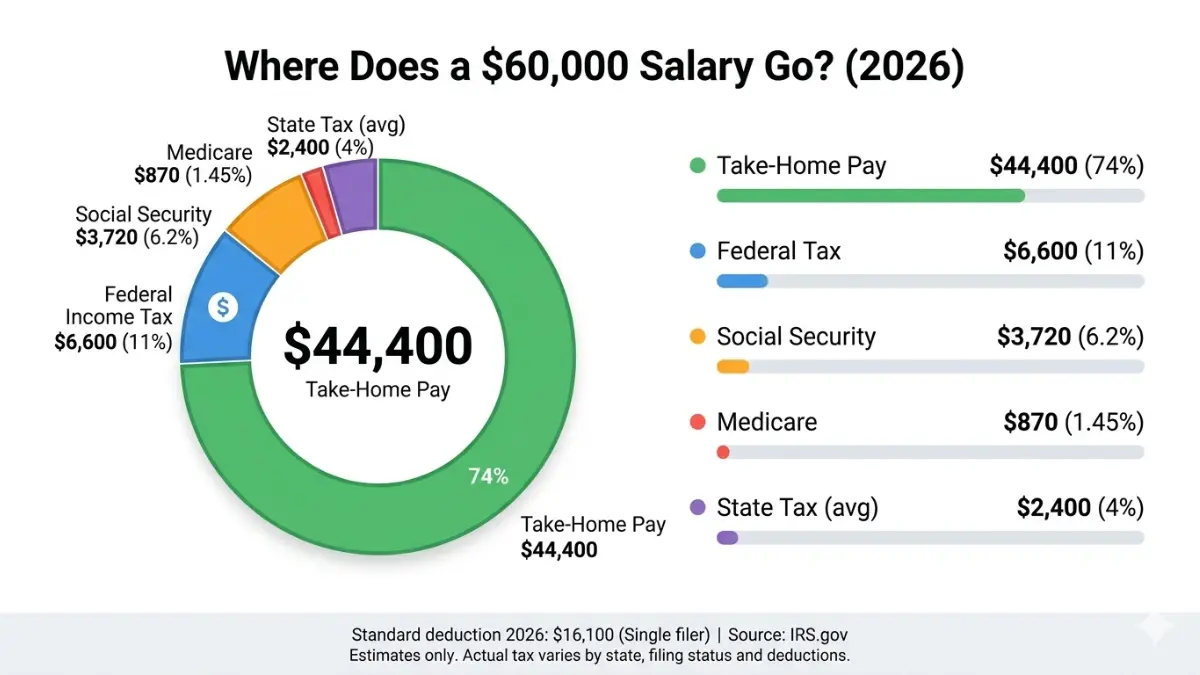
How Much of Your Salary Do You Actually Keep? (2026 Tax Guide)
Your gross salary is not your income. In 2026, the average American worker keeps approximately 70–78% of their gross pay after federal taxes, Social Security, and Medicare alone — before state taxes or any voluntary deductions.
2026 Federal Tax Brackets (Single Filers)
Based on IRS Revenue Procedure 2025-32, the 2026 federal income tax brackets for single filers are:
| Taxable Income | Tax Rate |
|---|---|
| Up to $12,400 | 10% |
| $12,401 – $50,400 | 12% |
| $50,401 – $105,700 | 22% |
| $105,701 – $201,775 | 24% |
| $201,776 – $256,225 | 32% |
| $256,226 – $640,600 | 35% |
| Over $640,600 | 37% |
Standard deduction 2026:
- Single filers: $16,100
- Married filing jointly: $32,200
- Head of household: $24,150
These are permanent under the One Big Beautiful Bill Act (OBBBA), signed July 4, 2025.
Which States Have No Income Tax in 2026?
Nine states impose zero state income tax on wages:
- Texas, Florida, Nevada, Washington, Wyoming, South Dakota, Alaska — no income tax at all
- Tennessee — no tax on wages
- New Hampshire — no tax on earned income (investment income only)
Real impact: A single earner on a $60,000 salary in Texas takes home approximately $900–$1,200 more per year than an identical earner in California, purely from state tax differences. When comparing job offers across state lines, your 2026 tax bracket analysis should always be the first step.
How Is Overtime Pay Calculated?
Under the Fair Labor Standards Act (FLSA), most non-exempt employees must be paid 1.5× their regular hourly rate for any hours beyond 40 per week.
Formula: Regular Hourly Rate × 1.5 × Overtime Hours = Overtime Pay
Real example: $25/hour base → $37.50 overtime rate. Working 10 overtime hours per week adds $19,500 to your annual gross (10 hrs × 52 weeks × $37.50).
Common misconception: Overtime is NOT taxed at a special higher rate. It’s taxed at your regular effective rate — but because it pushes your total income higher, it may move you into a higher marginal bracket for that portion.
Are Bonuses Taxed Differently?
Yes — but not in the way most people think.
The IRS treats bonuses as supplemental wages. Employers typically withhold a flat 22% federal rate on bonuses up to $1 million. This often results in over-withholding — meaning many workers get some bonus tax back at filing time.
Smart strategy: Maximize your pre-tax 401(k) contributions in the same pay period as your bonus. This reduces your taxable income for that period. Pair this with our 401(k) Calculator to model the exact tax savings.
What This Means For You: Evaluating a job offer in two different states — or with a bonus structure? Always compare net salaries, not gross. Our salary calculator lets you run both scenarios in under 60 seconds.
If your net pay still feels tight after running the numbers, a Debt-to-Income Ratio Calculator can tell you whether your current salary supports the financial commitments you’re carrying.
Frequently Asked Questions About Salary Calculators
1. How does a salary calculator work?
A salary calculator takes your base pay input — hourly, weekly, or annual — and applies your pay schedule, overtime, deductions, and an estimated tax rate to produce a gross vs. net pay breakdown. Our calculator covers 7 pay frequencies and 22 currencies, making it one of the most comprehensive free tools available in 2026.
2. What is the difference between gross salary and net salary?
Gross salary is your total pay before any deductions. Net salary — your take-home pay — is what remains after federal taxes, state taxes, FICA, and voluntary deductions are removed. For most US workers in 2026, net pay is 70–80% of gross pay.
3. How do I convert my hourly wage to an annual salary?
Multiply your hourly rate by 40 (hours per week) and then by 52 (weeks per year). Example: $20/hour × 40 × 52 = $41,600 annual gross. Use 2,080 as your divisor when converting annual salary back to hourly.
4. How much tax will I pay on a $50,000 salary in 2026?
A single filer earning $50,000 in 2026 would subtract the $16,100 standard deduction, leaving $33,900 in taxable income. Applying the 2026 brackets, the estimated federal income tax is approximately $3,666 — an effective rate of about 7.3% before FICA. Total effective burden including FICA sits around 14–16%.
5. What are pre-tax deductions and how do they help me?
Pre-tax deductions — like 401(k) contributions, HSA deposits, and health insurance premiums — are removed from your paycheck before federal income tax is calculated. This lowers your taxable income, meaning you pay less tax on every dollar contributed. Learn more in our income tax guide.
6. How is overtime pay calculated?
Overtime is your regular hourly rate × 1.5, applied to hours worked beyond 40 per week under the FLSA. Our salary calculator includes a dedicated overtime input field — enter your weekly overtime hours and multiplier for an exact annual estimate.
7. Why is my take-home pay less than my salary?
Because multiple deductions are applied before you receive your paycheck: federal income tax, Social Security (6.2%), Medicare (1.45%), any applicable state income tax, and your voluntary pre-tax deductions. Together, these typically reduce a paycheck by 20–30% or more.
8. What is an effective tax rate vs. a marginal tax rate?
Your marginal rate is the rate on your last dollar of income (e.g., 22%). Your effective rate is the average rate across all your income — almost always lower. A single filer earning $60,000 in 2026 has a 22% marginal rate but a roughly 14–16% effective rate.
9. How do I use the salary calculator to compare two job offers?
Run each offer separately using the same hours/week, tax rate, and deductions settings. The gross vs. net conversion table makes it easy to compare actual take-home pay at monthly or bi-weekly frequencies. For offers in different cities, pair this with our Retirement Calculator to model long-term wealth impact.
10. Does this salary calculator work for international currencies?
Yes. Our salary calculator supports 22 currencies including USD, GBP, EUR, CAD, AUD, INR, SGD, AED, JPY, and more. Select your currency before entering your pay rate. Note: tax estimates are illustrative — always confirm local tax obligations with a qualified advisor in your jurisdiction.
11. What is a bi-weekly pay schedule and how many paychecks is that per year?
A bi-weekly pay schedule means you are paid every two weeks — resulting in 26 paychecks per year. This is different from semi-monthly (24 paychecks per year, paid twice per month on fixed dates). Two months per year, bi-weekly workers receive 3 paychecks instead of the usual 2 — a valuable cash flow opportunity to redirect toward your Savings Calculator goals.
Expert Panel
This article has been reviewed and verified by Laura M. Bennett, CFP® and Daniel Moreau, CPA/CFP, members of financeauthorityhub.com’s panel of 30 internationally credentialed financial experts. All tax data is sourced from official IRS publications and verified against 2026 regulatory updates.
⚠️ Disclaimer: This salary calculator and article are provided for educational and informational purposes only. All results are estimates based on inputs provided and do not constitute financial, tax, legal, or payroll advice. Tax rules, rates, and deduction limits vary by jurisdiction, filing status, and individual circumstances. Always consult a qualified tax professional or certified financial advisor for advice specific to your situation. financeauthorityhub.com is not responsible for decisions made based on calculator outputs.
Informational disclaimer
The content on Finance Authority Hub is provided for general informational and educational purposes only and should not be considered personalized financial, investment, tax, legal, or professional advice. Financial decisions depend on your individual goals, income, risk tolerance, location, and regulatory situation. Before acting on any information, strategy, estimate, or calculator result, consult a qualified licensed professional who can evaluate your specific circumstances.