Break Even Calculator: Know Exactly When You Profit
Break Even Calculator
Calculate contribution margin, break-even units and sales, profit at expected volume, margin of safety, target-profit units, break-even time, and sensitivity tables (plus CSV export). Break-even units are commonly computed as fixed costs divided by contribution margin per unit (price − variable cost). [web:314][web:320]
Inputs
Results
Break-even (units)
—
Exact: —
Period: —
Break-even (sales)
—
Revenue at BE (units×price): —
Variable at BE: —
Margins
Contribution margin / unit: —
CM ratio: —
Inputs: — / —
Expected volume (if entered)
Units: —
Revenue: —
Profit (pre-tax): —
Profit (after-tax): —
Targets & safety
Fixed costs: — • Margin of safety: — units (—)
Target profit: — • Units needed: — (exact —) • Target sales: —
Break-even time (periods) from expected units: —
Reverse planning (optional)
Desired break-even units: — • Required price to break even: —
At that unit target, max variable cost (with current price): —
Step-by-step math
Sensitivity (Price ±5% vs Variable ±5%)
| Price change | Variable change | Price | Variable | CM | Break-even units |
|---|
Results appear after you click “Calculate.”
In This Article
Your break even calculator gives you the exact number of units or dollars you need to sell before your business stops losing money and starts making profit. Enter your fixed costs, price per unit, and variable cost per unit above — and you’ll know your break even point (BEP) in seconds. No finance degree required.
This is the most critical number every business owner, startup founder, and side hustler in America needs to know in 2026 — especially as fixed costs like rent and payroll continue rising.
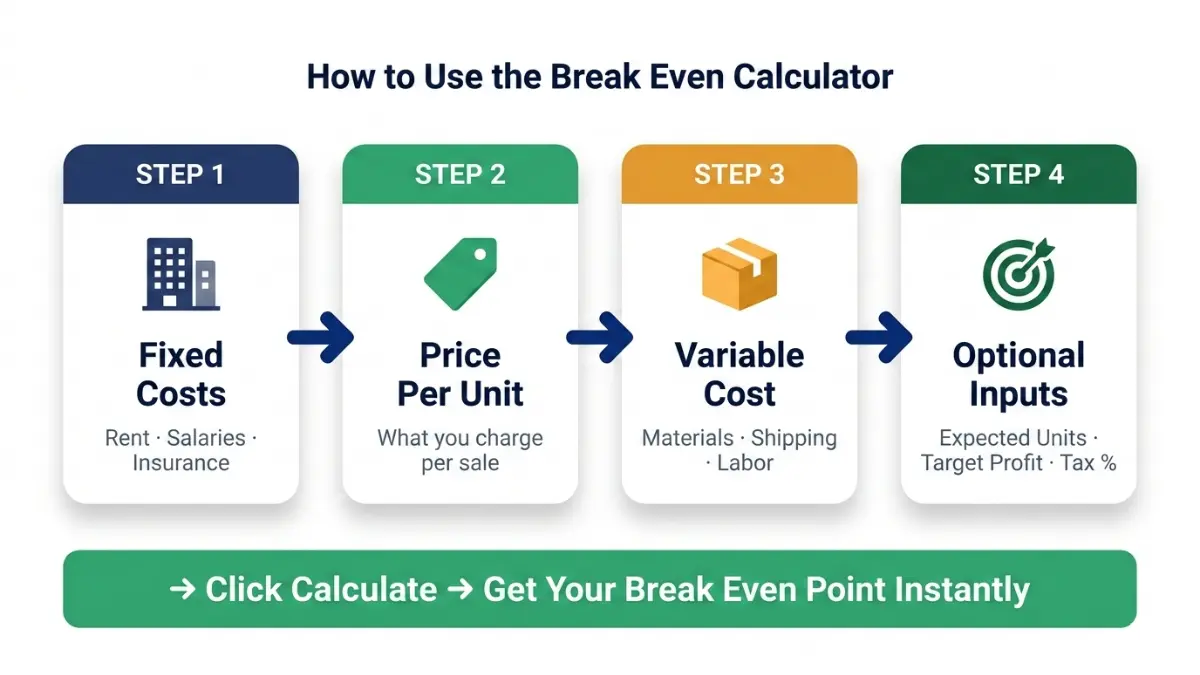
How to Use This Break Even Calculator
You only need three numbers to get started:
- Fixed Costs — Costs that don’t change month to month (rent, insurance, salaries, software subscriptions)
- Price Per Unit — What you charge one customer for one product or service
- Variable Cost Per Unit — What it costs you to produce or deliver one unit (materials, packaging, commissions)
Step-by-Step Instructions
Step 1 — Enter your fixed costs. Include rent, utilities, internet, software, and any salary you pay yourself. These are costs you owe whether you sell zero units or 1,000 units.
Step 2 — Enter your price per unit. This is your selling price — what one customer pays you.
Step 3 — Enter your variable cost per unit. For a product seller, this includes raw materials and shipping. For a service business, include contractor fees or hourly labor.
Step 4 — Add optional inputs for deeper results. Enter your expected monthly units, target profit, and tax percentage to unlock the full power of the calculator.
What Your Results Mean
Once you click Calculate, the tool gives you:
| Result | What It Tells You |
|---|---|
| Break-Even Units | Minimum units to sell per month before you profit |
| Break-Even Sales ($) | Minimum revenue needed to cover all costs |
| Contribution Margin | How much each sale contributes toward fixed costs |
| CM Ratio | Percentage of each revenue dollar that covers fixed costs |
| Margin of Safety | How many units above BEP you’re currently selling |
| Target-Profit Units | Units needed to hit a specific profit goal |
| Sensitivity Table | What happens to your BEP if price or costs shift ±5% |
Key Takeaway: If your expected units are below your BEP, you’re operating at a loss. If they’re above it, every extra unit sold is pure profit. Use the ROI Calculator to measure how those profits compound over time.
Break Even Point Formula — No Finance Degree Required
The break even point formula is simpler than most textbooks make it look. Here it is in plain English.
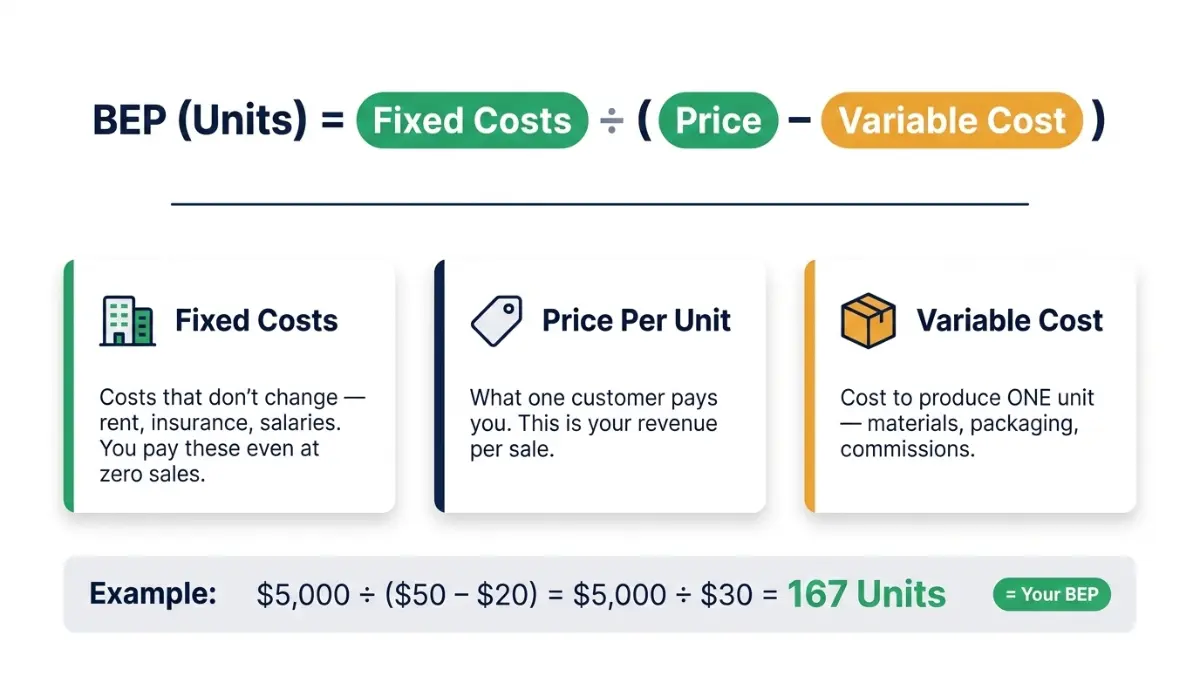
The Core Formula (Units)
BEP (Units) = Fixed Costs ÷ (Price Per Unit − Variable Cost Per Unit)
The denominator — Price minus Variable Cost — is called the Contribution Margin (CM). It’s the amount each sale contributes toward paying your fixed costs.
Example: Your fixed costs are $5,000/month. You sell a product for $50. It costs you $20 to make. Your CM = $30. Your BEP = $5,000 ÷ $30 = 167 units per month.
The Core Formula (Sales Dollars)
BEP (Sales $) = Fixed Costs ÷ Contribution Margin Ratio
Contribution Margin Ratio = CM ÷ Price
Example using the same numbers: CMR = $30 ÷ $50 = 60%. BEP in dollars = $5,000 ÷ 0.60 = $8,333/month in revenue.
According to the U.S. Small Business Administration, the break even analysis is a required component of any business plan presented to investors or lenders — and it’s the first calculation that exposes whether your pricing model is viable.
Quick-Reference Formula Table
| Formula | Inputs Needed | What It Answers |
|---|---|---|
| BEP (Units) = Fixed ÷ CM | Fixed costs, price, variable cost | How many units to sell |
| BEP (Sales $) = Fixed ÷ CMR | Fixed costs, CM ratio | How much revenue to generate |
| CM = Price − Variable Cost | Price, variable cost | Profit contribution per unit |
| CMR = CM ÷ Price | CM, price | % of revenue covering fixed costs |
| Target Units = (Fixed + Profit Goal) ÷ CM | Fixed, target profit, CM | Units needed for a specific profit |
Key Takeaway: The contribution margin is the engine of your profitability. The higher it is, the faster you break even and the more profit you generate after that point.
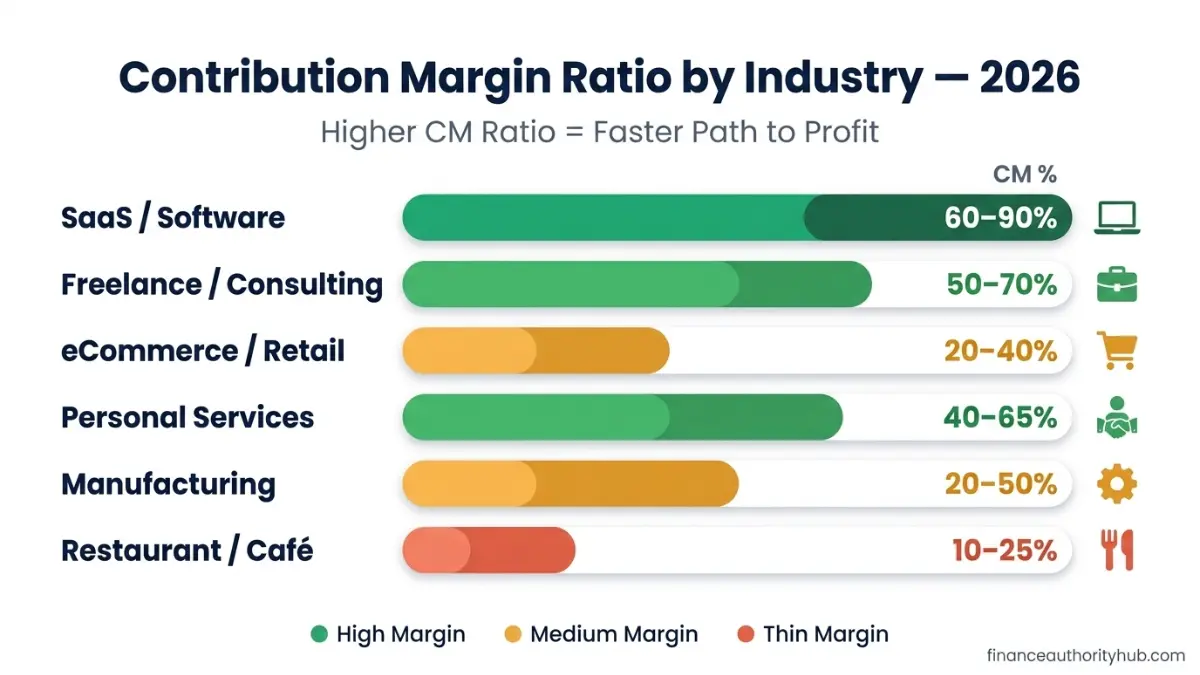
Break Even Point by Industry — 2026 Real Benchmarks
This is the data no competitor publishes. Here are real-world contribution margin benchmarks and typical BEP figures by industry, updated for 2026 conditions.
Industry Contribution Margin Benchmarks
| Industry | Typical CM Ratio | Avg Monthly Fixed Costs | Typical BEP (Monthly Revenue) |
|---|---|---|---|
| SaaS / Software | 60–90% | $8,000–$50,000 | $9,000–$83,000 |
| Freelance / Consulting | 50–70% | $2,000–$8,000 | $2,900–$16,000 |
| eCommerce / Retail | 20–40% | $3,000–$15,000 | $7,500–$75,000 |
| Restaurant / Café | 10–25% | $12,000–$40,000 | $48,000–$400,000 |
| Manufacturing | 20–50% | $20,000–$100,000 | $40,000–$500,000 |
| Personal Services | 40–65% | $1,500–$6,000 | $2,300–$15,000 |
If your CM ratio is below 20%, you need high volume to survive. If it’s above 50%, you have significant pricing power — and every increase in sales volume generates substantial profit.
How Inflation Has Shifted Break Even Points in 2026
Fixed costs — rent, insurance, utilities, wages — have increased significantly since 2021. According to the Bureau of Labor Statistics Consumer Price Index data, cumulative inflation since early 2021 through 2026 has exceeded 20% in many categories affecting small business overhead.
What this means for your business:
- A restaurant that needed $30,000/month to break even in 2020 may now need $38,000+ — purely from cost increases
- Service businesses face rising contractor and labor rates — pushing variable costs up and squeezing CM ratios
- Subscription software costs for businesses have increased an average of 15–25% over three years
This is why running a break even analysis in 2026 is non-negotiable — your numbers from two years ago are almost certainly outdated.
Margin of Safety — Are You Operating With a Buffer?
The margin of safety tells you how many units above your BEP you’re currently selling.
Margin of Safety (Units) = Expected Units − BEP Units
Margin of Safety (%) = MOS Units ÷ Expected Units × 100
Benchmark: A margin of safety above 20% is considered healthy for most small businesses. Below 10% means one bad month could push you into a loss. The calculator above calculates your margin of safety automatically once you enter expected units.
If your margin of safety is thin, consider using the Debt Consolidation Calculator to evaluate whether combining business debts could reduce your fixed monthly cost burden.
6 Proven Ways to Lower Your Break Even Point in 2026
Lowering your BEP means reaching profitability faster — and surviving any slow month. Here are six strategies that actually work.
1. Reduce Fixed Costs Without Cutting Quality
Audit every recurring expense line by line. Common targets:
- Unused software subscriptions
- Office space you can downsize or eliminate
- Insurance policies that haven’t been re-quoted in 2+ years
- Vendor contracts with locked-in pricing from 2021–2022
Key Takeaway: Cutting $500/month in fixed costs with a 40% CM ratio is the equivalent of adding $1,250 in monthly revenue.
2. Raise Your Price Strategically
A 10% price increase has a far greater impact on your BEP than a 10% volume increase. Here’s the math:
Before: Fixed $5,000, Price $50, Variable $20, CM $30 → BEP = 167 units After 10% price rise: Price $55, CM $35 → BEP = 143 units — a 24-unit drop
Most businesses underprice out of fear of losing customers. If your product or service is genuinely valuable, the data says: raise the price.
3. Cut Variable Costs Per Unit
- Renegotiate with suppliers annually — especially relevant in 2026 as global supply chains stabilize
- Buy materials in bulk when cash flow allows
- Automate repetitive production steps to reduce labor per unit
4. Use Target Profit Planning — Not Just Survival Planning
Most break even calculators stop at the BEP. Ours doesn’t. Enter a target profit in the calculator above, and it calculates exactly how many units you need to reach that goal.
Formula: Target-Profit Units = (Fixed Costs + Target Profit) ÷ CM
If your monthly goal is $3,000 profit with $5,000 fixed costs and a $30 CM → you need 267 units — not 167. That’s the sales goal you should give your team.
SCORE, the nation’s largest network of volunteer business mentors, recommends that every new business complete a break even analysis as the foundational step in financial planning — before projecting revenue or seeking funding.
5. Plan for Taxes From Day One
Pre-tax profit feels good. After-tax profit pays the bills. Use the Tax % field in the calculator to instantly see your after-tax profit at any expected volume.
Example: $4,000 pre-tax monthly profit at 25% tax rate = $3,000 after-tax — a $1,000 difference that shocks many first-time entrepreneurs. If you’re a self-employed business owner, you can also explore whether maximizing a Roth IRA Calculator contribution reduces your taxable income, effectively improving your after-tax BEP.
6. Run Sensitivity Analysis Before Raising Prices or Cutting Costs
The sensitivity table in the calculator shows you what happens to your BEP when price changes ±5% and variable costs change ±5%. This is critical for:
- Evaluating supplier price increases before they happen
- Testing pricing changes without risk
- Presenting scenarios to investors or business partners
Key Takeaway: If a 5% price drop pushes your BEP up by 30+ units, your business is price-sensitive and needs a wider margin buffer before reducing prices.
Break Even Calculator — 3 Real Business Scenarios
These are not hypothetical examples. These are real business models with 2026 cost structures.
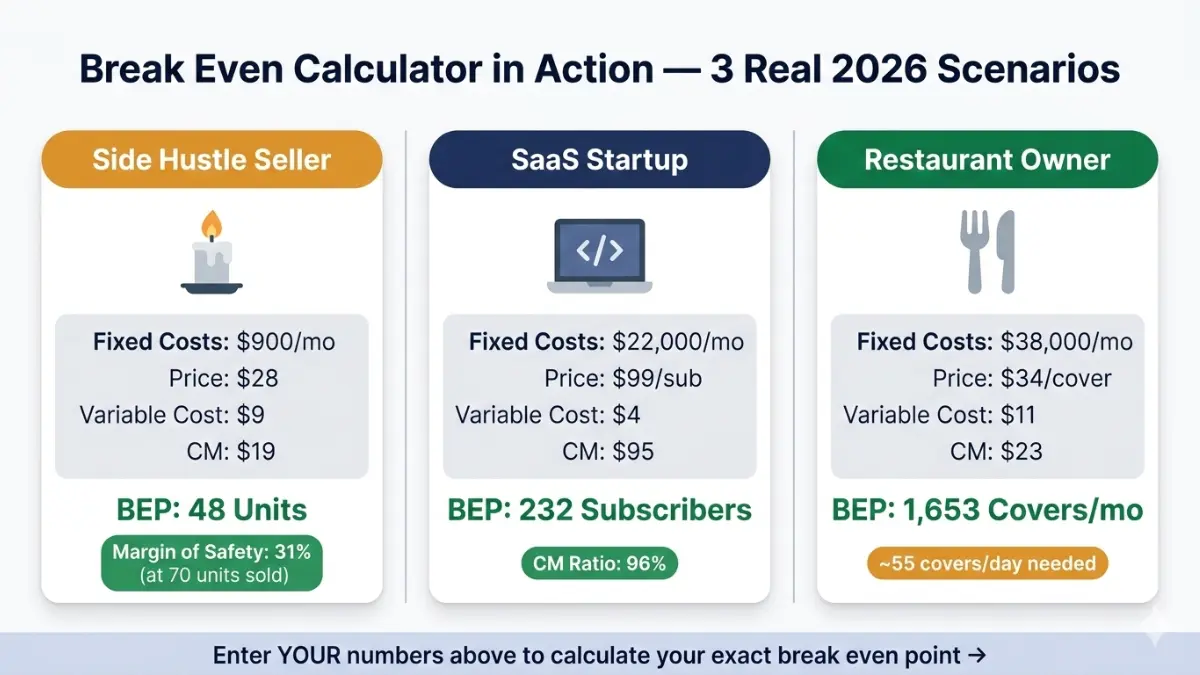
Scenario 1: The Etsy Side Hustle Seller
Business: Handmade candles sold on Etsy Fixed Costs: $900/month (Etsy fees, supplies storage, tools depreciation) Price Per Unit: $28 Variable Cost Per Unit: $9 (wax, wick, jar, packaging, shipping supplies) Contribution Margin: $19
BEP = $900 ÷ $19 = 48 candles/month
At 70 candles/month (a realistic goal), the margin of safety is 22 units — a healthy 31% buffer. Target profit of $1,000/month requires selling 101 candles.
What This Means For You: If you’re selling 40 candles a month and wondering why you’re not profitable — this is why. You need 8 more sales just to cover costs before you earn dollar one. The fix is either raising price by $3–$4 or cutting variable costs by improving packaging bulk orders.
Scenario 2: The SaaS Startup
Business: Project management tool, monthly subscriptions Fixed Costs: $22,000/month (team salaries, hosting, tools, office) Price Per Unit (sub): $99/month Variable Cost Per Unit: $4 (payment processing, support per user) Contribution Margin: $95
BEP = $22,000 ÷ $95 = 232 subscribers
At 300 subscribers, pre-tax monthly profit = $6,500. Target profit of $15,000/month requires 389 subscribers.
What This Means For You: SaaS businesses have exceptional CM ratios (96% here), which is why reaching the BEP unlocks rapid profit scaling. Every subscriber above 232 generates $95 in profit. Use the Investment Calculator to model how reinvesting early SaaS profits accelerates growth.
Scenario 3: The Restaurant Owner
Business: Fast-casual restaurant, urban location Fixed Costs: $38,000/month (rent, full-time staff, utilities, insurance, POS system) Average Price Per Cover: $34 Average Variable Cost Per Cover: $11 (food cost, disposables, card processing) Contribution Margin: $23
BEP = $38,000 ÷ $23 = 1,653 covers/month (approximately 55 covers per day)
Sensitivity check: if food costs rise 5%, variable cost becomes $11.55, CM drops to $22.45, and BEP jumps to 1,693 covers — 40 extra customers needed per month just to stand still.
What This Means For You: The restaurant industry’s thin CM ratio means any fixed cost increase is devastating. In 2026, restaurant owners facing rising minimum wage laws and higher food costs need to re-run their break even analysis every quarter, not once a year.
FAQs — Break Even Calculator
1. What is a break even calculator?
A break even calculator is a tool that computes the minimum number of units or revenue dollars a business must generate to cover all its costs. It uses three inputs: fixed costs, price per unit, and variable cost per unit.
2. What is the break even point formula?
BEP (Units) = Fixed Costs ÷ (Price Per Unit − Variable Cost Per Unit). In dollars: BEP ($) = Fixed Costs ÷ Contribution Margin Ratio.
3. What is contribution margin?
Contribution margin is the difference between your selling price and the variable cost per unit. It’s the amount each sale contributes toward covering fixed costs — and once fixed costs are covered, toward profit.
4. How do I calculate break even in sales dollars?
Divide your fixed costs by your contribution margin ratio (CM ÷ Price). If fixed costs are $6,000 and your CM ratio is 40%, your BEP in sales dollars is $6,000 ÷ 0.40 = $15,000/month.
5. What is a good break even point?
A good BEP is one you can realistically reach within your first 6–18 months, according to SCORE’s business planning guidance. Businesses with a margin of safety above 20% are generally considered stable.
6. What is the margin of safety?
The margin of safety is how many units or dollars you’re selling above your BEP. MOS% = (Expected Units − BEP Units) ÷ Expected Units × 100. A margin of safety above 20% indicates a healthy buffer against slow periods.
7. How does inflation affect my break even point?
Inflation raises fixed costs (rent, wages, utilities) and variable costs (materials, shipping). Both push your BEP higher. In 2026, small businesses should re-run their break even analysis quarterly to catch cost creep early.
8. Can I use this calculator for a service business?
Yes. For service businesses, your “variable cost per unit” is the direct cost of delivering one client engagement — contractor fees, software licenses tied to client volume, or per-session expenses.
9. What happens if my contribution margin is negative?
If variable cost exceeds price, your CM is negative — meaning every unit you sell increases your loss. You must either raise prices or reduce variable costs before anything else matters.
10. How many units do I need to sell to make a specific profit?
Use the Target Profit field in the calculator. The formula is: (Fixed Costs + Target Profit) ÷ Contribution Margin. This tells you exactly how many units to sell to hit any monthly income goal.
11. Is break even analysis the same as profit planning?
No. Break even analysis tells you the minimum to survive. Profit planning starts at the BEP and projects how much profit you generate at different sales volumes. The Savings Calculator can help you model what happens when you invest monthly profits over time.
📊 Need more financial tools? Explore our full suite at financeauthorityhub.com/tools — including the Business Loan Calculator to estimate financing costs and the Budget Calculator to manage monthly cash flow.
⚠️ Disclaimer: This article and calculator are provided for educational purposes only and do not constitute financial, accounting, tax, or business advice. Results from the break even calculator are estimates based on the inputs you provide and may not reflect actual business outcomes. Always consult a qualified financial advisor, CPA, or business consultant before making pricing, investment, or financing decisions for your business.
Informational disclaimer
The content on Finance Authority Hub is provided for general informational and educational purposes only and should not be considered personalized financial, investment, tax, legal, or professional advice. Financial decisions depend on your individual goals, income, risk tolerance, location, and regulatory situation. Before acting on any information, strategy, estimate, or calculator result, consult a qualified licensed professional who can evaluate your specific circumstances.