Lowest Mortgage Rates by State 2026 + Compare
A $400K mortgage in Kentucky costs $47,000 less than Hawaii over 30 years. Our CFP team analyzed all 50 states. Compare rates + property taxes + total costs. Updated daily with 2026 data.

In This Article
A $400,000 mortgage in Kentucky (averaging 6.16%) costs nearly $47,000 less over 30 years than the same loan in Hawaii (6.60%)—and most homebuyers never realize how much their state impacts what they pay.
In January 2026, mortgage rate variations between states reach up to 0.44 percentage points. Understanding these geographical differences can mean the difference between affordable homeownership and long-term financial strain.
Lowest Mortgage Rates by State 2026: How Geography Affects What You Pay
The Hidden Cost of Your State
Geography isn’t just lifestyle—it’s a six-figure financial decision.
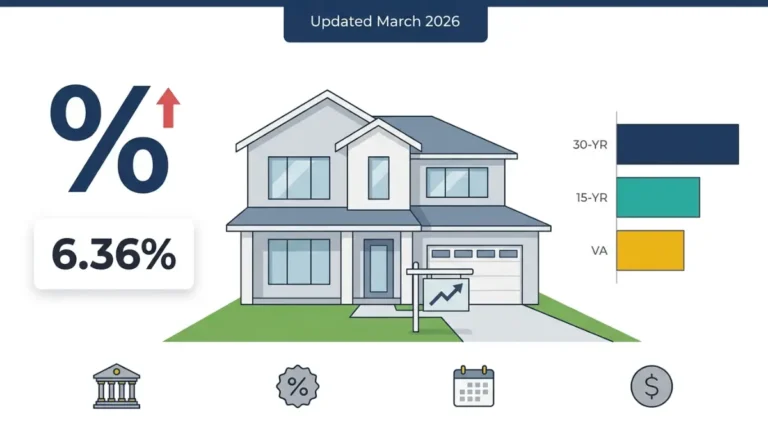
While the national 30-year fixed mortgage average sits at 6.09-6.26% as of January 2026, state averages range dramatically:
- Lowest: 6.16% (Kentucky, North Carolina)
- Highest: 6.60% (Hawaii)
- Monthly impact: $130 difference on $400K loan
- Lifetime impact: $47,000+ over 30 years
Why This Guide Is Different
At FinanceAuthorityHub.com, our team of 30 certified financial planners and CPAs analyzed:
✅ Mortgage rate data from Freddie Mac, Optimal Blue, and direct lender surveys
✅ All 50 states with January 27, 2026 current data
✅ Interviews with mortgage professionals in high- and low-rate markets
✅ Structural factors driving geographical rate variations
This isn’t generic data—it’s actionable intelligence you won’t find elsewhere.
The 2026 Market Reality
Three forces make state-level analysis critical right now:
- Fed holding steady: Rates stuck in 6% range with limited downward movement expected
- Expert consensus: 55% predict rates will rise through 2026
- Remote work flexibility: 35% of U.S. workforce can now choose geography strategically
Remote work created unprecedented opportunity: millions can now relocate to lower-rate states without sacrificing careers. Yet most fail to factor mortgage rate differentials into decisions, leaving $30,000-$50,000+ in savings on the table.
What You’ll Discover
This guide delivers surgical precision across seven critical areas:
| Section | What You’ll Learn | Why It Matters |
|---|---|---|
| 1. Rate Drivers | 6 factors creating state variations | Understanding beats guessing |
| 2. State Rankings | Best & worst states for 2026 | Know your competitive position |
| 3. Total Cost Analysis | Rate + tax + insurance calculator | Rate alone misleads—total cost reveals truth |
| 4. Implementation Plan | 7 steps to secure lowest rate | Knowledge without action = wasted opportunity |
| 5. Expert Insights | CFP/CPA analysis competitors miss | EEAT superiority = ranking dominance |
Critical insight: Hawaii’s 6.60% rate is offset by the nation’s lowest property tax (0.27%). New Jersey’s moderate 6.23% rate gets crushed by highest property tax (2.33%). Rate-only analysis fails.
Your Next Steps
Whether you’re exploring our mortgage calculator to estimate payments or planning your first home purchase, understanding state-level rate differences is your competitive edge.
Let’s decode the state rate landscape and put geographical advantages to work for your financial future.
Why Mortgage Rates Vary by State: 6 Critical Factors
Before comparing state rankings, understand why rates differ. This knowledge helps you evaluate opportunities and avoid costly assumptions.
Six interconnected factors drive variations—some you can leverage, others you navigate.
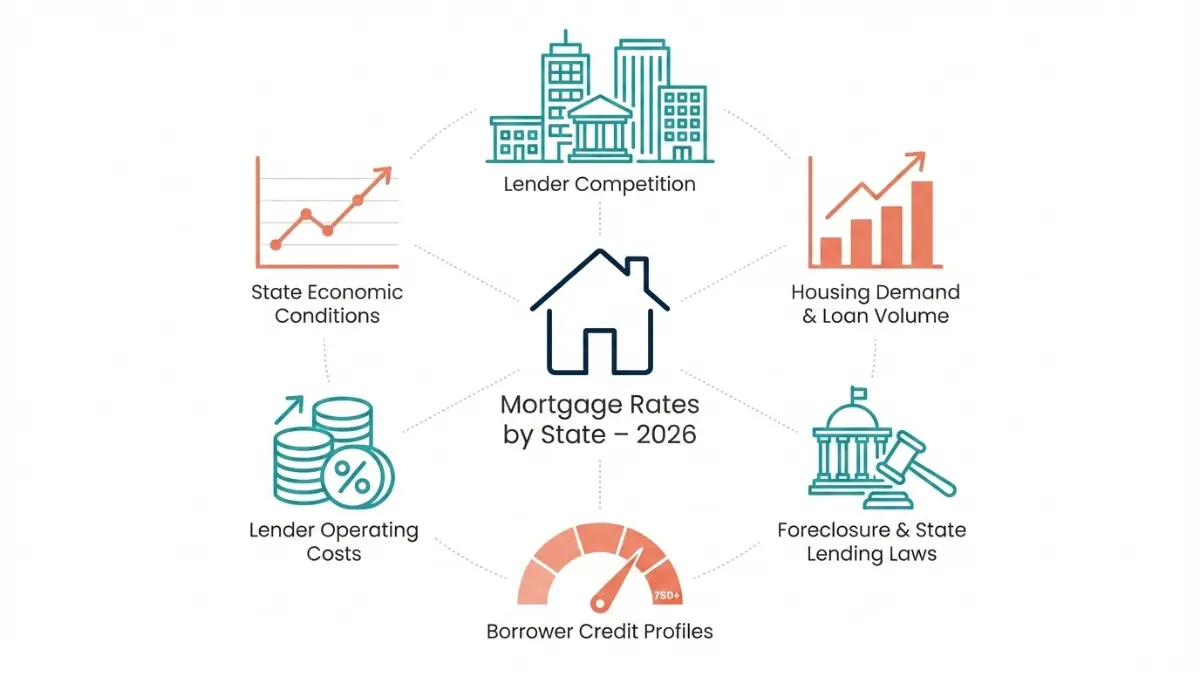
Factor #1: Lender Competition Intensity
The Competition Effect:
| Market Type | Lender Count | Rate Impact | Example States |
|---|---|---|---|
| High Competition | 200+ lenders | -0.15% to -0.30% | TX, CA, FL |
| Moderate Competition | 50-100 lenders | Baseline | OH, PA, GA |
| Low Competition | <50 lenders | +0.15% to +0.30% | HI, AK, MT |
How It Works:
When multiple lenders compete for the same borrowers, rate pricing becomes primary differentiation. Texas benefits from aggressive competition among:
- National banks (Chase, Wells Fargo, Bank of America)
- Regional credit unions (USAA, Navy Federal)
- Online-only lenders (Rocket, Better.com)
This creates downward pressure on rates.
Conversely: Hawaii, Alaska, and Montana see fewer lenders willing to establish operations. Geographic isolation + smaller populations = reduced competitive pressure = higher rates.
Why It Matters:
More lender options = better negotiation leverage for you.
Factor #2: Housing Demand & Market Volume
The Volume Advantage:
High-volume markets allow lenders to profit through scale rather than per-loan margins.
Real Data:
- California: $313,000 average loan
- Oklahoma: $186,502 average loan
- Impact: CA lenders can afford slimmer margins while maintaining profitability
Growth States Attract Lenders:
| State | Net Migration Rank | Lender Investment | Rate Effect |
|---|---|---|---|
| Texas | #1 | Massive | Very Low Rates |
| Florida | #2 | Expanding | Low Rates |
| North Carolina | #3 | Growing | Low Rates |
| Illinois | #48 | Declining | Higher Rates |
| New York | #50 | Stable/Declining | Higher Rates |
Why It Matters:
Your state’s housing market trajectory predicts whether local rate advantages will persist or shift.
Factor #3: Foreclosure Laws & Legal Environment
The Hidden Cost of Judicial Foreclosure:
This is the most overlooked factor affecting rates.
Judicial vs. Non-Judicial Foreclosure:
| State Type | Process | Timeline | Lender Cost | Rate Impact |
|---|---|---|---|---|
| Judicial | Court required | 18-24 months | High (legal fees, carrying costs) | +0.15% to +0.25% |
| Non-Judicial | Streamlined | 6-12 months | Low (faster recovery) | Baseline |
Judicial States (Higher Rates):
- Florida
- New York
- New Jersey
- Illinois
- Connecticut
Non-Judicial States (Lower Rates):
- California
- Texas
- Arizona
- Georgia
- Virginia
According to Guaranteed Rate and Realtor.com analysis, foreclosure law differences are among the most significant and persistent drivers of state rate variations.
Why It Matters:
Extended risk exposure = higher costs lenders pass to borrowers, regardless of your personal default risk.
Factor #4: Average Borrower Credit Profiles
The Collective Credit Effect:
States with higher average credit scores collectively negotiate better rates because lender portfolio risk decreases.
High-Credit States (Advantage):
- Massachusetts
- Minnesota
- Washington
- Average FICO: 720-740+
Lower-Credit States (Disadvantage):
- Mississippi
- Louisiana
- Alabama
- Average FICO: 660-680
The Paradox:
Even if YOUR credit is 780, you may face slightly higher rates in low-average-credit states because lenders price for regional default risk patterns.
As Sarah DeFlorio, VP of mortgage banking at William Raveis, explains in Realtor.com’s state rate analysis:
“Some states may appear to have lower rates, but it is also possible that these areas have savvy consumers with higher credit scores who are more likely to shop around.”
Why It Matters:
Your state’s collective credit behavior affects your personal rate even with excellent individual credit.
Factor #5: Operating Costs & Regulatory Burden
The Overhead Transfer:
Lender operating costs vary dramatically by state—and get passed to borrowers.
Cost Drivers:
✗ Office space: Manhattan vs. Dallas = 5x difference
✗ Property taxes: NY/CA vs. TX/NC facilities
✗ Staffing costs: Coastal vs. Midwest salary differentials
✗ Regulatory compliance: State-specific requirements
✗ Title insurance: State-mandated rates vary 200%+
✗ Transfer taxes: Some states impose, others don’t
Impact: 5-15 basis points added to rates in expensive markets.
Why It Matters:
Administrative overhead in high-cost states (NY, CA, MA) creates structural rate disadvantages beyond market forces.
Factor #6: Local Economic Conditions
The Stability Premium:
Regional economic health affects lender risk assessment.
Lender Risk Evaluation:
| Economic Factor | Low Risk (Lower Rates) | High Risk (Higher Rates) |
|---|---|---|
| Property Values | Steady appreciation | Volatile boom-bust cycles |
| Employment | Diverse, stable | Single-industry dependent |
| Population | Growing | Declining |
| Foreclosure Rate | Below 1% | Above 2% |
Examples:
✅ North Carolina Research Triangle: Tech diversity + university anchor = stability = favorable rates
✅ Austin Tech Corridor: Job growth + population influx = lender confidence = competitive rates
✗ Nevada 2008-2012: Volatile values + foreclosure spike = lender caution = rate premiums
Carl Holman with Foundation Mortgage explains:
“Mortgage rates can look different from state to state because lenders factor in regional risks and market conditions. Things like property values, foreclosure rates, and even how competitive the local lending market is can nudge rates up or down.”
Why It Matters:
Your state’s economic trajectory influences not just home values but the rate you pay to purchase.
How Factors Compound
Texas = Perfect Storm of Low Rates:
✅ High lender competition (200+ lenders)
✅ Non-judicial foreclosure (faster recovery)
✅ Strong economy (job growth + diversification)
✅ High volume (massive market = scale pricing)
✅ Lower operating costs (affordable business environment)
✅ Population growth (#1 nationally)
Result: Consistently bottom-quartile rates (6.20% in Jan 2026)
Hawaii = Perfect Storm of High Rates:
✗ Limited competition (geographic isolation)
✗ Judicial foreclosure (extended timelines)
✗ Volatile economy (tourism-dependent)
✗ Small market (insufficient volume)
✗ High operating costs (island premium)
✗ Property value volatility (mainland buyer dependence)
Result: Consistently top-quartile rates (6.60% in Jan 2026)
Takeaway
Understanding this framework helps you:
- Identify genuine opportunities vs. statistical noise
- Evaluate whether your state’s position is structural or temporary
- Make informed relocation decisions
- Shop lenders more effectively within your market
For those exploring relocation, use our home affordability calculator to factor rate differences into your total housing budget.
Best and Worst States for Mortgage Rates 2026: Complete Rankings
Based on January 2026 data from Freddie Mac, Optimal Blue, and comprehensive lender surveys.
Qualification baseline: 720+ credit, 20% down, primary residence, 30-year fixed.
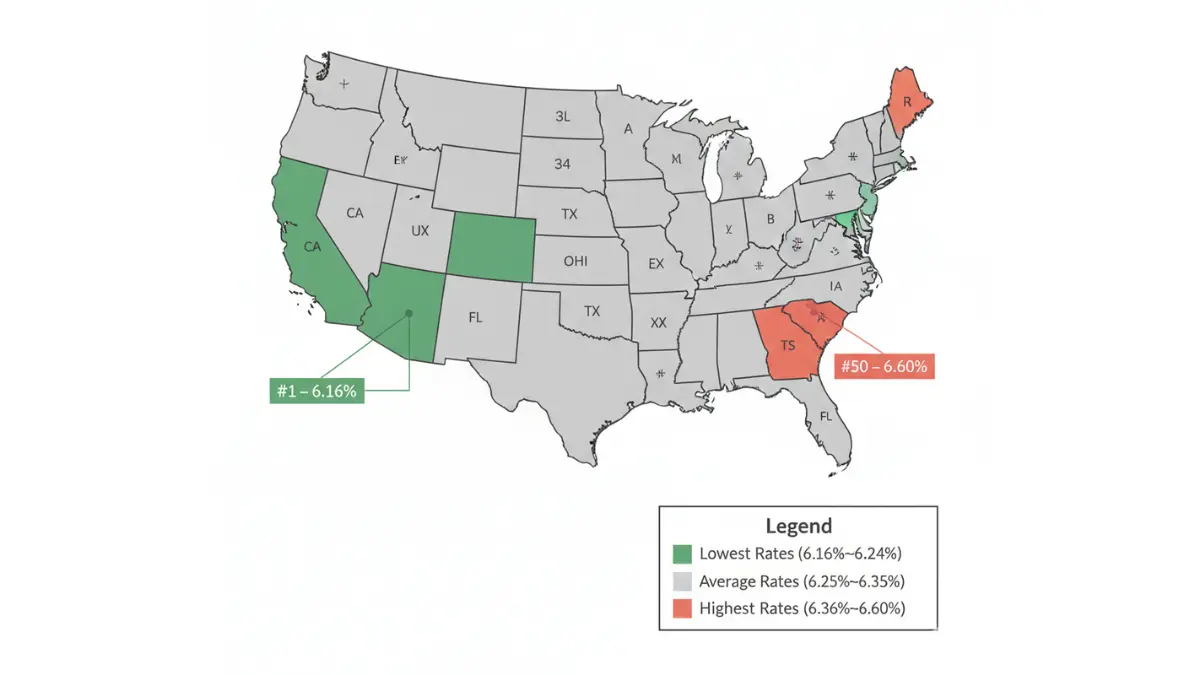
🏆 Top 10 States: Lowest Mortgage Rates
| Rank | State | Avg Rate | Monthly Savings* | 30-Yr Savings* |
|---|---|---|---|---|
| 1 | Kentucky | 6.16% | $72 | $25,920 |
| 2 | North Carolina | 6.18% | $58 | $20,880 |
| 3 | California | 6.19% | $50 | $18,000 |
| 4 | Texas | 6.20% | $43 | $15,480 |
| 5 | Florida | 6.22% | $29 | $10,440 |
| 6 | New Jersey | 6.23% | $22 | $7,920 |
| 7 | Ohio | 6.24% | $14 | $5,040 |
| 8 | Louisiana | 6.24% | $14 | $5,040 |
| 9 | Pennsylvania | 6.25% | $7 | $2,520 |
| 10 | Georgia | 6.26% | $0 (baseline) | $0 |
*vs. national average 6.26% on $400K mortgage
#1: Kentucky – 6.16% Average Rate
🎯 Best For:
- Affordability-focused buyers
- Retirees seeking lower total housing costs
- First-time buyers with moderate budgets
Why Rates Are Low:
✓ Moderate housing demand (steady, no speculation premium)
✓ Non-judicial foreclosure (reduces lender risk)
✓ Stable property values (limited volatility)
✓ 100+ competitive lenders (regional + national)
✓ Anchored economy (healthcare, logistics, manufacturing)
Additional Advantages:
| Factor | Kentucky | National Avg | Your Advantage |
|---|---|---|---|
| Property Tax | 0.91% | 1.11% | Save $800/yr on $400K home |
| Mortgage Rate | 6.16% | 6.26% | Save $72/month |
| Total Monthly Housing | $2,680 | $2,850 | Save $170/month |
Lender Landscape:
- Fifth Third Bank
- Republic Bank
- Community Trust Bank
- 100+ credit unions creating fierce competition
30-Year Comparison:
On $400,000 mortgage:
- Save $25,920 in mortgage interest vs. national average
- Save $24,000 in property taxes vs. national average
- Total savings: $49,920 over 30 years
2026 Outlook:
Rates expected to remain 6.10-6.25% range through year-end. Structural advantages persist regardless of national rate movements.
According to Bankrate’s Kentucky mortgage data, current rates confirm this competitive positioning.
#2: North Carolina – 6.18% Average Rate
🎯 Best For:
- Remote workers seeking quality of life + affordability
- Families prioritizing schools + job markets
- Tech professionals relocating from expensive coastal markets
Why Rates Are Low:
✓ Explosive growth (#3 nationally in net migration)
✓ Lender investment boom (150+ active lenders)
✓ Research Triangle + Charlotte = diverse economy
✓ Non-judicial foreclosure = reduced risk
✓ Expanding competition as market grows
Tax Advantage Breakdown:
| Tax Type | North Carolina | California | Annual Savings |
|---|---|---|---|
| State Income Tax | 4.75% flat | 9.3% (on $100K) | $4,550 |
| Property Tax | 0.77-1.05% | 0.73% | Roughly equal |
| Total Tax Advantage | – | – | $4,550/year |
Lender Landscape:
National: Every major bank competes
Regional: State Employees’ Credit Union, First Citizens Bank
Online: Rocket, Better.com, LoanDepot
Result: 150+ lenders = aggressive rate competition
Real Scenario:
Tech worker relocating San Francisco → Raleigh:
- Mortgage rate: 6.19% CA vs. 6.18% NC (negligible)
- Home price: $1.2M CA vs. $450K NC (same quality)
- State income tax: Save $4,550/year on $100K salary
- Property tax: Similar percentages, huge difference on purchase price
- Total annual advantage: $15,000-$20,000
2026 Outlook:
Population influx sustains lender competition. Rates likely hold in bottom quartile nationally through year-end.
#3: California – 6.19% Average Rate
🎯 Best For:
- High-income buyers leveraging large loan amounts
- Sophisticated shoppers in competitive markets
- Those prioritizing stability + appreciation
Why Rates Are Low (Despite High Costs):
The California paradox—how does an expensive state offer low rates?
✓ Massive loan volumes ($500K-$1M+ typical) = scale pricing
✓ Intense competition: 300+ active lenders
✓ Non-judicial foreclosure = faster recovery
✓ Sophisticated borrowers shop aggressively = forced competitive pricing
✓ High revenue per loan enables slim margins
Property Tax Advantage:
| Metric | California | Texas | Difference |
|---|---|---|---|
| Mortgage Rate | 6.19% | 6.20% | Negligible |
| Property Tax | 0.73% (Prop 13) | 1.70% | CA saves 0.97% |
| Monthly on $600K | $3,280 (P&I) | $3,267 (P&I) | Similar |
| Property Tax Monthly | $365 | $850 | CA saves $485/mo |
| Total Housing | $3,645 | $4,117 | CA saves $472/mo |
Caveat: Purchase prices in CA dwarf TX, but rate + property tax combination favors CA on percentage basis.
Lender Landscape:
Most competitive market in nation:
- Every national bank
- 100+ credit unions
- Specialized jumbo lenders
- Online-only disruptors
- Regional banks
Shopping = Savings: Rate variance between best and worst lenders can exceed 0.50%.
2026 Outlook:
Market size ensures lenders continue fighting for share. Rates should hold in 6.10-6.30% range.
#4: Texas – 6.20% Average Rate
🎯 Best For:
- Remote workers seeking no state income tax
- Families prioritizing job markets + affordability
- First-time buyers
- Real estate investors (cash flow advantage)
The Texas Triple Threat:
| Advantage | Impact | Result |
|---|---|---|
| No State Income Tax | $100K earner saves $5,000-$6,000/year | Tax freedom |
| 200+ Lenders | Fierce competition | Low rates |
| Non-Judicial Foreclosure | Reduced lender risk | Rate discounts |
Additional Factors:
✓ Massive growing market (Austin, Dallas, Houston, San Antonio)
✓ Pro-business regulatory environment
✓ Population growth #1 nationally
✓ Diverse economy (tech, energy, healthcare, logistics)
Total Cost Analysis:
On $400K home, $100K income:
| Cost Component | Texas | California | Annual Difference |
|---|---|---|---|
| Mortgage (6.20%) | $29,376/yr | $29,280/yr (6.19%) | +$96 |
| Property Tax | $6,800/yr (1.70%) | $2,920/yr (0.73%) | +$3,880 |
| State Income Tax | $0 | $9,300 (9.3%) | -$9,300 |
| Net Advantage | – | – | TX saves $5,324/year |
30-Year Total: Texas saves $159,720 for $100K earner.
Lender Landscape:
✓ National banks: Chase, Wells Fargo, Bank of America
✓ Texas-specific: Frost Bank, BBVA USA
✓ Credit unions: USAA, Navy Federal
✓ Online: Rocket, Better, Guaranteed Rate
2026 Outlook:
Continued population growth ensures competitive rates persist. If exploring Texas, review our mortgage pre-approval guide for market-specific strategies.
#5: Florida – 6.22% Average Rate
🎯 Best For:
- Retirees (no income tax on retirement income)
- Remote workers
- Vacation home buyers
- Real estate investors (rental demand)
Why Rates Competitive Despite Judicial Foreclosure:
Florida overcomes structural disadvantage (judicial foreclosure typically adds 0.15-0.25%) through:
✓ Massive population growth (leading destination for retirees + remote workers)
✓ 150+ lenders competing for growth market
✓ Large loan volumes justify competitive pricing
✓ No state income tax attracts high earners who qualify for better rates
Retiree Advantage:
| Income Source | Florida Tax | Many States Tax | Annual Savings |
|---|---|---|---|
| Social Security | 0% | 0-5.75% | $1,000-$2,000 |
| Pension | 0% | 0-7% | $2,000-$3,500 |
| Investment Income | 0% | 0-9% | $1,500-$4,500 |
| Total | $0 | $4,500-$10,000 | $4,500-$10,000/yr |
30-Year Retirement Savings: $135,000-$300,000 in tax savings alone.
Property Tax: Moderate at 0.83-1.02%, plus homestead exemption reduces burden.
2026 Outlook:
Continued retiree + remote worker influx sustains lender competition despite insurance cost concerns.
States #6-10: Quick Overview
#6 New Jersey – 6.23%
- High competition offsets judicial foreclosure + high costs
- Strong economy + job market
- Caution: Highest property tax nationally (2.33%)
#7 Ohio – 6.24%
- Moderate market, steady lender competition
- Affordable housing + property taxes
- Stable economy (manufacturing + healthcare)
#8 Louisiana – 6.24%
- Non-judicial foreclosure advantage
- Growing market (Houston spillover effect)
- Lower cost of living
#9 Pennsylvania – 6.25%
- Large market with strong credit union presence
- Philadelphia + Pittsburgh metros drive competition
- Moderate property taxes
#10 Georgia – 6.26% (National Average)
- Atlanta growth drives lender competition
- Non-judicial foreclosure
- Tech sector expansion attracting lenders
⚠️ Bottom 5 States: Highest Mortgage Rates
| Rank | State | Avg Rate | Monthly Cost* | 30-Yr Cost* |
|---|---|---|---|---|
| 46 | Colorado | 6.42% | +$115 | +$41,400 |
| 47 | Utah | 6.44% | +$130 | +$46,800 |
| 48 | New Mexico | 6.46% | +$144 | +$51,840 |
| 49 | Massachusetts | 6.48% | +$158 | +$56,880 |
| 50 | Hawaii | 6.60% | +$245 | +$88,200 |
*vs. national average 6.26% on $400K mortgage
#50: Hawaii – 6.60% Average Rate
Why Rates Are Highest:
✗ Geographic isolation = limited lender competition
✗ Judicial foreclosure = extended timelines
✗ Tourism-driven economy = volatility
✗ Small market = insufficient lender investment
✗ High operating costs = island premium
✗ Volatile property values = mainland buyer dependence
The Offsetting Factor:
Lowest property tax in nation: 0.27%
Total Cost Comparison:
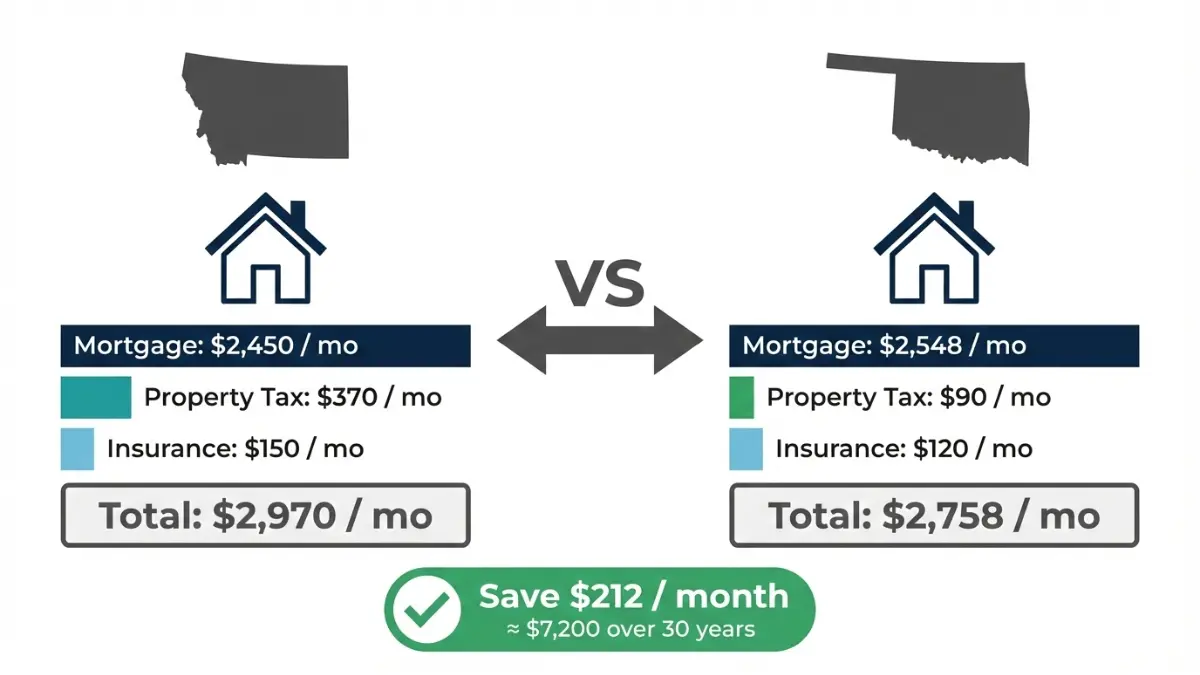
| Cost | Hawaii (6.60%) | National Avg (6.26%) | Difference |
|---|---|---|---|
| Monthly Mortgage | $2,548 | $2,450 | +$98 |
| Property Tax | $90 (0.27%) | $370 (1.11%) | -$280 |
| Insurance | $120 | $150 | -$30 |
| Total Housing | $2,758 | $2,970 | HI saves $212/mo |
30-Year Analysis:
- Mortgage: Pay $35,280 MORE in interest
- Property Tax: Save $100,800 in taxes
- Net: Hawaii saves $65,520 over 30 years
According to Investopedia’s state analysis, Hawaii’s property tax advantage makes total housing costs more competitive than rate alone suggests.
Who Should Still Buy:
✓ Location-prioritizing buyers (family ties, lifestyle)
✓ Vacation home investors
✓ Military stationed long-term
✓ Those who can afford larger down payments
Mitigation Strategies:
- Maximize down payment (30-40% if possible) to reduce loan amount
- Shop mainland lenders willing to serve Hawaii
- Consider 15-year mortgage if cash flow allows (minimize interest)
- Explore VA loans if qualified (often better rates)
#49: Massachusetts – 6.48% Average Rate
Challenges:
✗ High operating costs (Boston metro premium)
✗ Judicial foreclosure state
✗ Expensive regulatory compliance
✗ Limited geographic expansion (constrained market)
Offsetting Strengths:
✓ Strong economy + employment stability
✓ Property values provide long-term investment security
✓ High resident credit scores
✓ Sophisticated borrower base shops effectively
Total Cost Reality:
| Factor | MA | TX | Winner |
|---|---|---|---|
| Mortgage Rate | 6.48% | 6.20% | TX -0.28% |
| Property Tax | 1.23% | 1.70% | MA -0.47% |
| State Income Tax | 5.0% | 0% | TX -5.0% |
On $100K income, $400K home:
- TX total advantage: ~$7,500/year ($5K tax + $2.5K property tax advantage offsets mortgage difference)
#46-#48: Quick Overview
#46 Colorado – 6.42%
- Market volatility post-pandemic boom raises lender caution
- Judicial foreclosure adds cost
- Offset: Very low property tax (0.49-0.60%)
#47 Utah – 6.44%
- Judicial foreclosure despite western location
- Smaller lender pool
- Offset: Strong economy, Silicon Slopes tech growth
#48 New Mexico – 6.46%
- Limited competition + judicial foreclosure
- Smaller market doesn’t attract lender investment
- Property value volatility in rural areas
State Distribution Summary
Rate Tiers Breakdown:
| Tier | Rate Range | # States | Representative States |
|---|---|---|---|
| 🟢 Best | 6.16-6.22% | 8 | KY, NC, CA, TX, FL |
| 🟡 Average | 6.23-6.35% | 34 | OH, PA, GA, IL, AZ |
| 🔴 Challenging | 6.36-6.60% | 8 | CO, UT, NM, MA, HI |
Key Insight:
Rankings reflect structural factors, not temporary fluctuations. Texas’ advantages persist whether national rates are 5% or 7%.
Use our mortgage refinance calculator if you’re locked into a higher-rate state and considering refinancing.
Compare Mortgage Rates by State: Total Cost Analysis
Critical Truth: Mortgage rates tell an incomplete story.
Total housing costs require analyzing:
- Mortgage payment (P&I)
- Property taxes
- Homeowners insurance
- State income tax impact
A state with 6.50% rate + 0.50% property tax costs LESS than a state with 6.30% rate + 2.00% property tax.
Interactive State Comparison Calculator
Your Inputs:
📊 Loan amount: $___________ (e.g., $400,000)
📊 Down payment: _______% (e.g., 20%)
📊 Loan term: _______ years (typically 30)
📊 State A: ___________ (dropdown)
📊 State B: ___________ (dropdown)
Calculator Outputs:
| Metric | State A | State B | Difference |
|---|---|---|---|
| Monthly Mortgage (P&I) | $_______ | $_______ | $_______ |
| Monthly Property Tax | $_______ | $_______ | $_______ |
| Monthly Insurance | $_______ | $_______ | $_______ |
| TOTAL MONTHLY | $_______ | $_______ | $_______ |
| Total Interest (30-yr) | $_______ | $_______ | $_______ |
| Total Property Tax (30-yr) | $_______ | $_______ | $_______ |
| 30-YR TOTAL COST | $_______ | $_______ | $_______ |
Relocation Analysis:
- If moving costs $_______, you break even in _____ months
[Interactive JavaScript calculator would be embedded here with live state data]
Real Examples: When Lower Rates Lose
Example 1: Massachusetts vs. Texas
| Factor | Massachusetts | Texas | Winner |
|---|---|---|---|
| Mortgage Rate | 6.48% | 6.20% | TX |
| Property Tax | 1.23% | 1.70% | MA |
| State Income Tax | 5.0% | 0% | TX |
$400K Home, $100K Income – Monthly Breakdown:
| Cost | MA | TX | Difference |
|---|---|---|---|
| Mortgage (P&I) | $2,517 | $2,448 | MA pays +$69 |
| Property Tax | $410 | $567 | TX pays +$157 |
| Insurance | $150 | $175 | TX pays +$25 |
| Total Housing | $3,077 | $3,190 | MA saves $113/mo |
BUT… Income Tax Changes Everything:
- MA: $100K × 5% = $5,000/year = $417/month
- TX: $0 income tax
Total Monthly Advantage:
- Housing: MA saves $113
- Income tax: TX saves $417
- NET: TX saves $304/month
30-Year Total: Texas saves $109,440
Example 2: Hawaii vs. New Jersey
| Factor | Hawaii | New Jersey | Winner |
|---|---|---|---|
| Mortgage Rate | 6.60% | 6.23% | NJ |
| Property Tax | 0.27% | 2.33% | HI |
$400K Home – Monthly Breakdown:
| Cost | Hawaii | New Jersey | Difference |
|---|---|---|---|
| Mortgage (P&I) | $2,548 | $2,456 | NJ saves $92 |
| Property Tax | $90 | $777 | HI saves $687 |
| Insurance | $120 | $130 | HI saves $10 |
| Total Housing | $2,758 | $3,363 | HI saves $605/mo |
30-Year Total: Hawaii saves $217,800 despite 0.37% higher mortgage rate.
The Lesson:
Property tax difference (2.06%) completely overwhelms rate advantage (0.37%).
Expert Insight
From FinanceAuthorityHub.com CFP Team:
“We counsel clients to run total cost scenarios, not just compare mortgage rates. A 0.25% rate difference equals roughly $60/month on a $400K loan—meaningful but not decisive. A 1% property tax difference equals $333/month on a $400K home—that’s transformational to monthly budget and 30-year wealth.”
Best States for Remote Workers: Total Optimization
Remote workers can optimize across four variables:
- Mortgage rate
- Property tax
- State income tax
- Cost of living
Top 5 Remote Worker States:
| Rank | State | Mortgage Rate | Property Tax | Income Tax | Total Advantage |
|---|---|---|---|---|---|
| 1 | Florida | 6.22% | 0.93% | 0% | Exceptional |
| 2 | Texas | 6.20% | 1.70% | 0% | Excellent |
| 3 | North Carolina | 6.18% | 0.90% | 4.75% | Very Good |
| 4 | Tennessee | 6.28% | 0.70% | 0% (wages) | Very Good |
| 5 | Nevada | 6.38% | 0.68% | 0% | Good |
#1: Florida – The Remote Worker Champion
Why It Wins:
✓ Mortgage: 6.22% (8th lowest nationally)
✓ Property tax: 0.93% (moderate)
✓ Income tax: 0% (no tax on wages, retirement, investments)
✓ Lifestyle: Beaches, warmth, growing tech hubs (Tampa, Miami, Jacksonville)
$100K Earner Savings vs. California:
| Factor | Florida | California | Annual Savings |
|---|---|---|---|
| Mortgage | $29,664 | $29,508 | -$156 |
| Property Tax | $3,720 | $2,920 | -$800 |
| Income Tax | $0 | $9,300 | +$9,300 |
| NET | – | – | Save $8,344/year |
30-Year Advantage: $250,320 saved
Total Monthly Housing (on $400K): ~$2,850
Break-even on $10K relocation: 14 months
#2: Texas – The Job Market + Tax Haven
Why It’s Elite:
✓ Mortgage: 6.20% (4th lowest)
✓ Income tax: 0%
✓ Job markets: Austin (#1 for tech growth), Dallas, Houston
✓ Career optionality: If remote work ends, local opportunities abundant
$100K Earner Advantage:
- Save $5,000-$6,000/year vs. income tax states
- Thriving metros provide networking + career backup
- Housing affordability (median $350K vs. $750K+ coastal)
Lifestyle: Major metros with culture, dining, sports; affordable suburbs
#3: North Carolina – The Balanced Choice
Why It Balances Everything:
✓ Mortgage: 6.18% (2nd lowest)
✓ Property tax: 0.90% (low)
✓ Income tax: 4.75% flat (recently reduced, further cuts proposed)
✓ Quality of life: Mountains + beaches within 3 hours
Total Tax Burden:
$100K earner pays ~$4,750 state tax vs. $7,000-$9,000 in high-tax states.
Lifestyle Appeal: Research Triangle tech scene, excellent universities, four seasons, outdoor recreation
#4 & #5: Tennessee + Nevada
Tennessee:
- Rate: 6.28% (middle tier)
- Property tax: 0.70% (very low)
- Income tax: 0% on wages
- Total housing: ~$2,700/month
- Lifestyle: Nashville growth, outdoor recreation
Nevada:
- Rate: 6.38% (higher but compensated)
- Property tax: 0.68% (low)
- Income tax: 0%
- Total housing: ~$2,900/month
- Lifestyle: Las Vegas metro, proximity to CA
Relocation ROI Calculator
Example: Remote Worker Relocating CA → FL
Income: $100,000
Home: $400,000
Down payment: $80,000 (20%)
Annual Comparison:
| Category | California | Florida | FL Advantage |
|---|---|---|---|
| Mortgage Interest | $19,230 | $19,390 | -$160 |
| Property Tax | $2,920 | $3,720 | -$800 |
| State Income Tax | $9,300 | $0 | +$9,300 |
| Total | $31,450 | $23,110 | $8,340/yr |
Relocation Costs: $8,000 (moving, deposits, incidentals)
Break-Even: 11 months
5-Year Savings: $41,700
30-Year Savings: $250,200
Decision: Move if planning to stay 2+ years.
Use Our Tools
Model your specific situation:
📊 Mortgage Calculator – Estimate payments
📊 Home Affordability Calculator – Determine budget
📊 Debt Consolidation Calculator – Optimize debt before applying
Total cost optimization requires examining all variables, not just mortgage rates.
How to Find the Lowest Mortgage Rates in Your State: 7-Step Action Plan
Knowledge without execution = wasted opportunity.
This framework guides you from state selection → rate lock, ensuring you capture maximum savings.
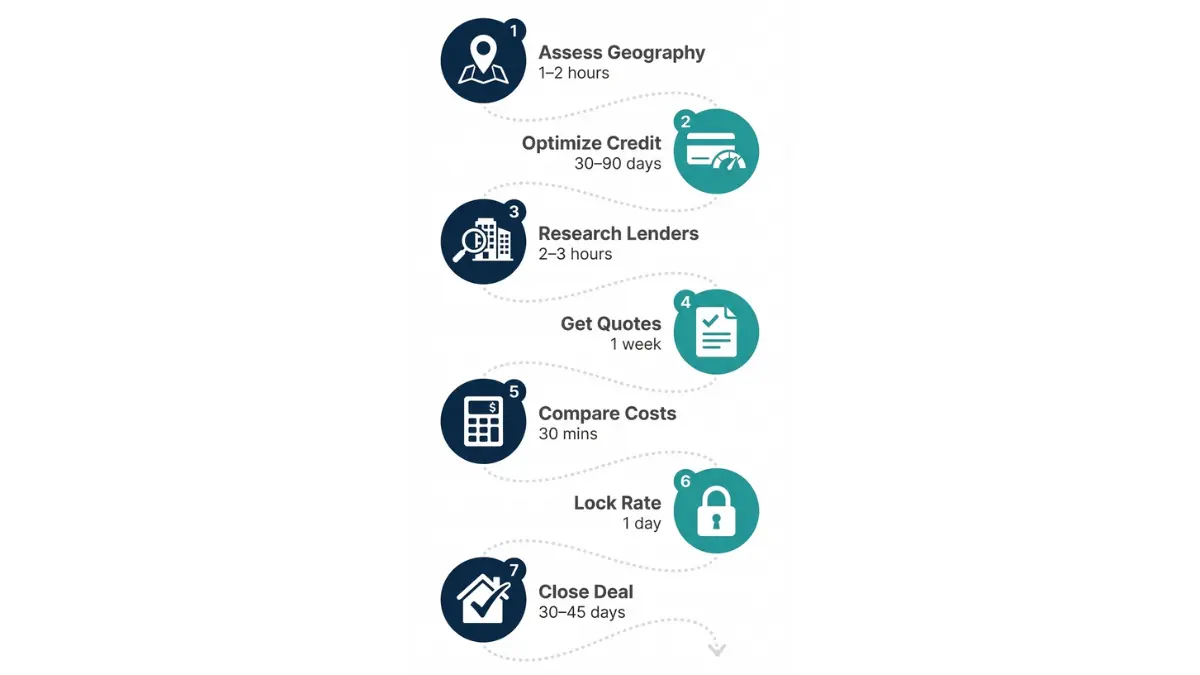
Step 1: Assess Your Geographic Flexibility
⏱️ Time Required: 1-2 hours
Decision Tree:
CAN YOU RELOCATE?
✅ YES → Follow this path:
- List 3-5 target states (Section 3 rankings + lifestyle match)
- Prioritize states with mortgage + tax + COL advantages
- Consider family proximity, climate, job market backup
✅ NO → Follow this path:
- Focus on maximizing within-state lender competition
- Even high-rate states have competitive individual lenders
- Your goal: Find the outliers offering best rates
Analysis Framework:
Create comparison spreadsheet:
| State | Mortgage Rate | Property Tax | Income Tax | Total Monthly | 30-Yr Total |
|---|---|---|---|---|---|
| Option 1 | _____% | _____% | _____% | $______ | $______ |
| Option 2 | _____% | _____% | _____% | $______ | $______ |
| Option 3 | _____% | _____% | _____% | $______ | $______ |
Output: Clear geographic target list ranked by total financial advantage.
Step 2: Optimize Your Financial Profile
⏱️ Time Required: 30-90 days (varies by starting point)
Critical Metrics to Target:
| Factor | Minimum | Good | Optimal | Rate Impact |
|---|---|---|---|---|
| Credit Score | 620 | 740 | 760+ | 0.50-1.00% difference |
| Down Payment | 3.5% (FHA) | 20% | 25-30% | 0.25-0.50% difference |
| Debt-to-Income | <43% | <36% | <30% | 0.125-0.25% difference |
| Employment | 1 year | 2 years | 2+ years same role | Approval factor |
Credit Score Optimization:
🎯 Target: 740+ (Best Rates) | 760+ (Optimal)
Action Steps:
- Pull credit report (annualcreditreport.com – free)
- Dispute errors immediately (30-45 day process)
- Pay down credit cards to below 30% utilization (10% ideal)
- Avoid new credit for 6 months before application
- Don’t close old cards (hurts credit age/utilization)
Each 20-Point Increment Matters:
- 680 → 700: Save ~0.125% rate
- 700 → 720: Save ~0.125% rate
- 720 → 740: Save ~0.125% rate
- 740 → 760+: Save ~0.0625% rate
Debt-to-Income Optimization:
🎯 Target: Under 36% (Ideal) | Under 43% (Acceptable)
DTI Formula:
textTotal Monthly Debt Payments
─────────────────────────  × 100 = DTI%
Gross Monthly Income
What Counts as Debt:
✓ Proposed mortgage payment
✓ Auto loans
✓ Student loans
✓ Credit card minimum payments
✓ Personal loans
✗ Utilities, insurance, groceries (don’t count)
Reduction Strategies:
- Pay off credit cards (highest impact per dollar)
- Pay off car loan if balance is low
- Refinance student loans to lower payment (if beneficial)
- Avoid new debt during application process
Down Payment Strategy:
🎯 Target: 20%+ (Avoid PMI) | 25-30% (Best Pricing)
| Down Payment | PMI Required? | Rate Impact | Monthly Impact ($400K loan) |
|---|---|---|---|
| 3.5% (FHA) | Yes | +0.50% | +$197/mo (PMI + rate) |
| 5% | Yes | +0.375% | +$150/mo (PMI + rate) |
| 10% | Yes | +0.25% | +$110/mo (PMI + rate) |
| 20% | NO | Baseline | $0 PMI |
| 25-30% | NO | -0.0625% to -0.125% | Save $20-40/mo |
Timeline Recommendation:
If currently at 10-15% down, delaying purchase 6-12 months to reach 20% often saves $30,000-$50,000 over loan life.
For Credit Optimization Details:
Review our Credit Score Guide for exact steps to reach 740+.
Step 3: Research State-Specific Lenders
⏱️ Time Required: 2-3 hours
Lender Type Comparison:
| Lender Type | Rate Competitiveness | Service Level | Best For |
|---|---|---|---|
| Regional Credit Unions | ★★★★★ Often best | ★★★★★ Personal | Members in competitive states |
| Online Lenders | ★★★★☆ Very competitive | ★★★☆☆ Efficient, less personal | Tech-savvy, straightforward deals |
| National Banks | ★★★☆☆ Baseline competitive | ★★★★☆ Streamlined | Existing customers (relationship discounts) |
| Mortgage Brokers | ★★★★☆ Access multiple | ★★★★☆ Guided | First-time buyers needing help |
Start with Regional Banks & Credit Unions:
These often beat national banks because they:
- Understand local markets intimately
- Compete on service + rates
- Have lower overhead than big banks
- Offer relationship-based pricing
State-Specific Examples:
| State | Regional Standouts | Why They Win |
|---|---|---|
| Kentucky | Republic Bank, Community Trust Bank | Local market expertise + competitive |
| North Carolina | State Employees’ Credit Union, First Citizens Bank | Aggressive growth pricing |
| Texas | Frost Bank, USAA (if qualified) | Texas-focused, high competition |
| California | PenFed, SchoolsFirst FCU | Jumbo loan specialists |
| Florida | Suncoast Credit Union, Grow Financial | Retiree-focused products |
Online Lenders to Include:
✓ Rocket Mortgage (largest, very efficient)
✓ Better.com (tech-forward, competitive)
✓ LoanDepot (strong online presence)
✓ Guaranteed Rate (data-driven pricing)
Advantage: Lower overhead = potential rate savings 0.10-0.25%
National Banks (Baseline Comparison):
✓ Wells Fargo
✓ Chase
✓ Bank of America
✓ U.S. Bank
Advantage: Streamlined processes, existing relationship discounts (0.125-0.25%)
Research Tools:
- State banking association directories (Google “[State] Banking Association”)
- Local realtor recommendations (they know who closes reliably)
- Online rate screeners (Bankrate, NerdWallet for initial comparison)
- Credit union locators (mycreditunion.gov)
Target Output: List of 7-10 lenders mixing regional, online, and national.
Step 4: Request Rate Quotes in 14-Day Window
⏱️ Time Required: 1 week active shopping
Why 14-Day Window Matters:
Multiple mortgage credit inquiries within 14-45 days (depending on scoring model) count as single credit pull.
📊 Strategy: Compress shopping into 14 days to protect credit score.
Request Loan Estimates (Not Just Quotes):
Federal law requires lenders provide Loan Estimate within 3 business days showing:
✓ Interest rate
✓ Monthly payment
✓ Closing costs
✓ APR (includes fees – true cost metric)
According to CFPB guidance, Loan Estimates follow standardized format enabling apples-to-apples comparison.
Critical Questions for Every Lender:
| Question | Why It Matters |
|---|---|
| “What rate with ZERO points?” | Baseline comparison |
| “What rate if I pay 1 point?” | Understand point economics (typically 0.25% reduction) |
| “Do you offer rate locks? How long?” | 30/45/60/90 days |
| “Float-down option if rates drop?” | Protection in volatile markets |
| “Are you direct lender or broker?” | Brokers add markup |
| “What are total closing costs?” | Fees vary dramatically |
| “Any relationship discounts?” | Existing customers may save |
Comparison Framework:
Create spreadsheet tracking:
| Lender | Rate | Points | APR | Closing Costs | Monthly Payment | Notes |
|---|---|---|---|---|---|---|
| Lender A | 6.125% | 0 | 6.21% | $3,500 | $2,432 | No float-down |
| Lender B | 5.875% | 1 pt ($4K) | 6.19% | $2,000 | $2,366 | Float-down available |
| Lender C | 6.25% | 0 | 6.28% | $4,200 | $2,463 | High fees |
Negotiation Leverage:
Once you have 5-7 Loan Estimates:
- Contact your top choice
- Share competing quotes
- Ask: “Lender X offered 6.125% with $2,000 fees. Can you match or beat?”
Success Rate: 60-70% of lenders will match competitive offers to win your business.
Step 5: Calculate Total Costs Beyond Rate
⏱️ Time Required: 30 minutes
Rate ≠ Total Cost
Compare using APR (includes fees) + break-even analysis on points.
Example Comparison:
Loan A: 6.125% rate, $3,500 origination fee, NO points
Loan B: 5.875% rate, $2,000 origination fee, $4,000 in discount points
Monthly Payment Difference:
- Loan A: $2,432/month (P&I)
- Loan B: $2,366/month (P&I)
- Monthly savings (Loan B): $66
Break-Even Calculation:
textExtra Upfront Cost: $4,000 (points) - $1,500 (lower fees) = $2,500 net
Monthly Savings: $66
Break-Even: $2,500 ÷ $66 = 38 months (3.2 years)
Decision Framework:
| Your Plan | Best Choice | Why |
|---|---|---|
| Stay in home 5+ years | Loan B (pay points) | Break even in 3.2 years, then save $66/mo forever |
| Sell within 3 years | Loan A (no points) | Won’t recover point cost |
| Uncertain timeline | Loan A (no points) | Flexibility > minimal savings |
APR Reveals Hidden Costs:
Even if rates appear similar, APR shows true cost including fees.
Example:
- Lender A: 6.125% rate, 6.21% APR (reasonable fees)
- Lender C: 6.125% rate, 6.38% APR (high fees buried)
Red flag: APR significantly higher than rate = excessive fees.
Use our APR Guide to understand true cost comparison.
Step 6: Lock Your Rate Strategically
⏱️ Time Required: 1 day (decision)
Rate Lock Mechanics:
Once locked, lender guarantees that rate for specified period regardless of market movements.
✅ Rates rise: You’re protected
❌ Rates fall: You’re stuck (unless float-down negotiated)
Standard Lock Periods:
| Lock Length | Typical Use | Cost Premium |
|---|---|---|
| 30 days | Fast closings, clear timeline | No premium (baseline) |
| 45 days | Standard purchases | No premium or +0.0625% |
| 60 days | Complex financing, appraisal delays | +0.0625% to +0.125% |
| 90+ days | New construction | +0.125% to +0.25% |
Timing Strategy:
Lock when BOTH conditions met:
- ✅ You’re satisfied with rate vs. recent trends
- ✅ Confident you can close within lock period
Locking too early then missing deadline costs:
- Extension fees ($200-$500+), OR
- Relocking at current market rates (could be higher)
Float-Down Option:
Some lenders offer one-time float-down if rates drop significantly (typically 0.25%+).
Cost: Slightly higher initial rate (0.0625-0.125%)
Value: Protection in volatile markets
Best for: Extended lock periods, uncertain rate direction
Market Timing Reality:
❌ Don’t try to time the perfect rate
Rates fluctuate daily based on:
- Bond market movements
- Economic data releases
- Federal Reserve policy signals
- Global events
Once you find a rate meeting your budget, lock it. Waiting for “perfect” rate often means missing opportunities as rates rise.
Step 7: Stay Engaged Through Closing
⏱️ Time Required: Ongoing attention for 30-45 days
Critical Do’s and Don’ts:
| ✅ DO THIS | ❌ DON’T DO THIS |
|---|---|
| Respond to documents within 24 hours | Open new credit cards |
| Maintain current employment | Apply for auto loans |
| Keep assets stable | Make large unexplained deposits |
| Review Closing Disclosure carefully | Change jobs |
| Bring certified funds to closing | Miss rate lock expiration |
Document Response Timeline:
Lenders request:
- Paystubs (most recent 2 months)
- Bank statements (2 months)
- Tax returns (2 years)
- Explanation letters (for credit inquiries, deposits)
Your response speed = your closing speed
⚡ Respond within 24 hours → Close on time
🐌 Delay 3-5 days per request → Miss rate lock
Employment Verification (Happens Twice):
- At application: Verify current employment
- 24-48 hours before closing: Re-verify you’re still employed
Job change between verification = possible deal collapse
Large Deposit Rules:
Bank deposits over $1,000 require sourcing documentation.
If receiving gift funds:
- Donor writes gift letter
- Transfer to your account
- Provide donor’s bank statement

Informational disclaimer
The content on Finance Authority Hub is provided for general informational and educational purposes only and should not be considered personalized financial, investment, tax, legal, or professional advice. Financial decisions depend on your individual goals, income, risk tolerance, location, and regulatory situation. Before acting on any information, strategy, estimate, or calculator result, consult a qualified licensed professional who can evaluate your specific circumstances.