Home Equity Calculator — Instant Results, Real Numbers
Home Equity Calculator
Calculate your home equity (gross and net after selling costs), LTV/CLTV, “available to borrow” at a target CLTV, cash‑out refinance estimate, sensitivity grid, multi‑year projections, and CSV export.
Inputs
Equity is commonly described as home value minus mortgage/liens. [web:269][web:277]
CLTV is commonly shown as combined loan balances ÷ home value. [web:277]
Cash-out estimates often use (value × LTV limit) − balances − closing costs. [web:275]
Results
Baseline
Home value: —
Total debt: —
Equity %: —
Equity (gross)
—
First-lien LTV: —
CLTV: —
Net equity after sale (optional)
—
Selling costs: —
Net equity %: —
Available to borrow (planning)
Target CLTV: —
Max debt @ target: —
Available now: —
Paydown needed (if above): —
Cash-out refinance estimate (simple model)
Target first-lien LTV: — • Max new first loan: —
Closing costs: — • Estimated cash-out: — • Shortfall (if none): —
This follows the common “LTV limit” style estimate (rules vary by lender/product). [web:275]
Step-by-step math
Sensitivity (quick “what-if”)
| Value change | Debt change | Value | Debt | Equity | CLTV |
|---|
Projection (year by year)
| Year | Home value | First mortgage | Total debt | Equity | CLTV | Available @ target CLTV |
|---|
Results appear after you click “Calculate.”
In This Article
Your home is likely your biggest financial asset — and our free home equity calculator shows exactly how much of it you can tap. Home equity is the difference between your home’s current market value and your total outstanding mortgage balances. For example, a $400,000 home with a $260,000 mortgage gives you $140,000 in equity (35%). Use the calculator above to get your number in seconds.
⚡ 2026 Data Alert: The national average home equity loan rate is 7.84% and the average HELOC rate is 7.18% as of March 2026 — both at their lowest levels in three years. This is one of the most favorable windows to tap your equity in recent memory.
Millions of American homeowners are sitting on record equity right now. Knowing your exact equity, LTV ratio, and borrowing limit gives you real financial power — whether you’re planning a renovation, consolidating debt, or simply tracking your net worth.
Before you borrow, use our Home Affordability Calculator alongside this tool to understand your full housing financial picture.
How to Use This Home Equity Calculator (Step-by-Step)
Our calculator goes far beyond the basic tools on NerdWallet or Bankrate. Here’s exactly what to enter and what you’ll get back.
Step 1 — Enter Your Inputs
Fill in the following fields:
- Home Value — Use a recent appraisal, Zillow estimate, or your purchase price adjusted for market appreciation
- First Mortgage Balance — Find this on your latest mortgage statement
- Second Mortgage / Home Equity Loan Balance — Enter 0 if you don’t have one
- HELOC Drawn Balance — The amount you’ve actually borrowed on a line of credit (not the limit)
- Other Liens — Any tax liens, HOA liens, or judgment liens on the property
- Selling Costs % — Typically 6% in the U.S. (agent commissions + closing costs)
- Target CLTV % — Set this to 80% to see how much you could borrow at the standard lender limit
- Appreciation Rate — U.S. average is 3–5% annually; use your local market rate
Step 2 — Choose Your Paydown Mode
Select one of three options:
- No Paydown — Shows your current static equity position
- Simple Annual Paydown — Enter a dollar amount you plan to pay extra each year
- Amortization Mode — Enter your APR, months remaining, and optional extra monthly payment to model real loan payoff
Step 3 — Read Your Results
The calculator instantly shows you:
| Result | What It Means |
|---|---|
| Gross Equity | Home value minus all loans and liens |
| Equity % | Your ownership stake as a percentage |
| First-Lien LTV | First mortgage ÷ home value × 100 |
| CLTV | All debts combined ÷ home value × 100 |
| Net Equity After Sale | What you’d pocket after agent fees and closing costs |
| Available to Borrow | How much you can access at your target CLTV |
| Cash-Out Refi Estimate | Estimated cash you could pull with a refinance |
| Sensitivity Grid | How your equity shifts if home value drops or rises 10% |
| Year-by-Year Projection | How equity and LTV change over time |
💡 What This Means For You: Most homeowners only know their gross equity. This calculator shows your net equity (after sale costs), your available equity (what lenders will actually let you borrow), and your projected equity years from now — three numbers no competitor tool gives you together.
For a deeper view of your complete mortgage picture, explore our Mortgage Refinance Calculator.
How Much Can You Borrow? LTV Thresholds Explained (2026)
This is the question every homeowner actually wants answered. The answer depends on your Combined Loan-to-Value (CLTV) ratio — not just your first mortgage LTV.
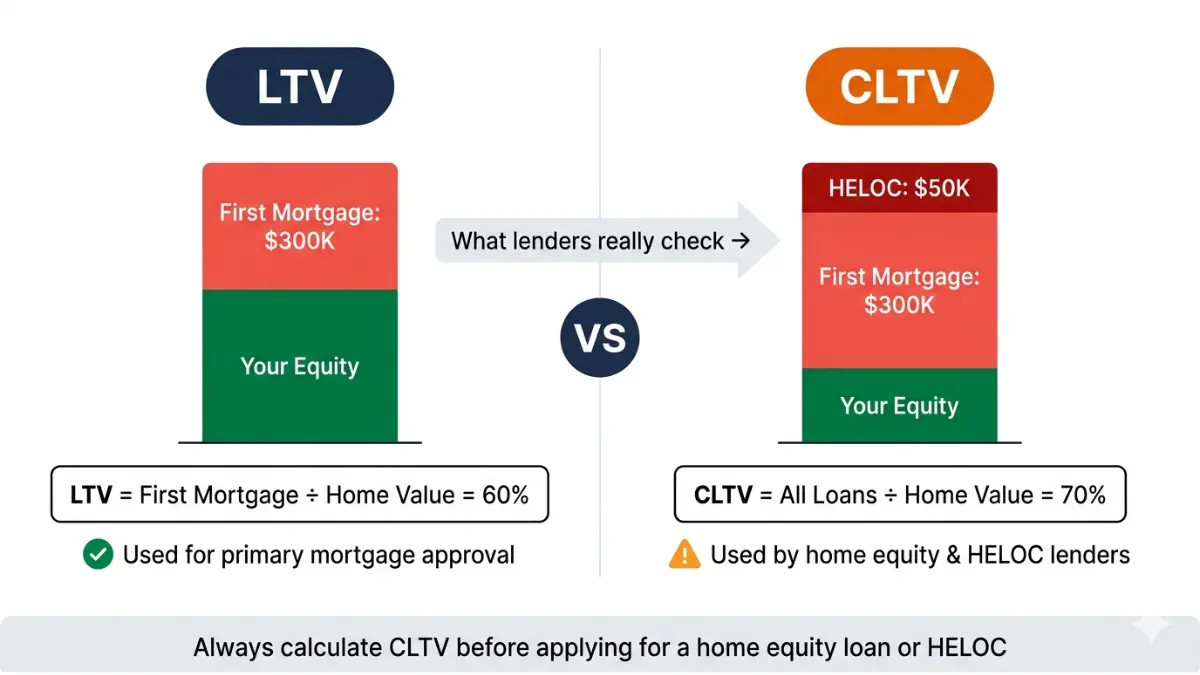
LTV vs. CLTV — The Difference That Costs Thousands
Most people confuse these two numbers. Here’s the critical distinction:
- LTV (Loan-to-Value) = First mortgage balance ÷ Home value × 100
- CLTV (Combined LTV) = All loan balances (first mortgage + second mortgage + HELOC) ÷ Home value × 100
Example: Home worth $500,000. First mortgage: $300,000. HELOC balance: $50,000.
- LTV = 300,000 ÷ 500,000 = 60% (looks great)
- CLTV = 350,000 ÷ 500,000 = 70% (this is what lenders actually use)
Lenders always use CLTV to determine eligibility. The CFPB’s official guide on home equity products confirms that both home equity loans and HELOCs are assessed against total property indebtedness.
2026 LTV Threshold Table — Your Borrowing Roadmap
| CLTV Range | What It Means for You |
|---|---|
| Below 80% | Best rates available; eligible for HELOC + home equity loan; PMI removal threshold |
| 80–85% | HELOC still accessible; rates slightly higher; most major lenders still approve |
| 85–90% | Fewer lenders; stricter underwriting; may need 680+ credit score |
| Above 90% | Most lenders decline home equity products; cash-out refi also unlikely |
Current 2026 Home Equity Rates
- Home Equity Loan (avg): 7.84% as of March 2026 — at their lowest in three years
- HELOC (avg): 7.18% as of March 2026 — also at the lowest since 2022
- The Federal Reserve projects only one rate cut in 2026, so dramatic decreases are unlikely — but the current window is favorable
Home Equity Loan vs. HELOC — Which Is Right for You?
| Feature | Home Equity Loan | HELOC |
|---|---|---|
| Payout | Lump sum upfront | Draw as needed |
| Rate Type | Fixed | Variable (prime + margin) |
| Best For | One-time expense (renovation, debt payoff) | Ongoing costs (tuition, medical bills) |
| Monthly Payment | Fixed and predictable | Changes with balance and rate |
| Risk | Lower (stable payment) | Higher (rate can rise) |
| Typical Term | 5–30 years | 10-year draw + 20-year repayment |
According to the Consumer Financial Protection Bureau, both options use your home as collateral — meaning failure to repay can result in foreclosure.
If debt consolidation is part of your goal, run the numbers using our Debt Consolidation Calculator before you commit.
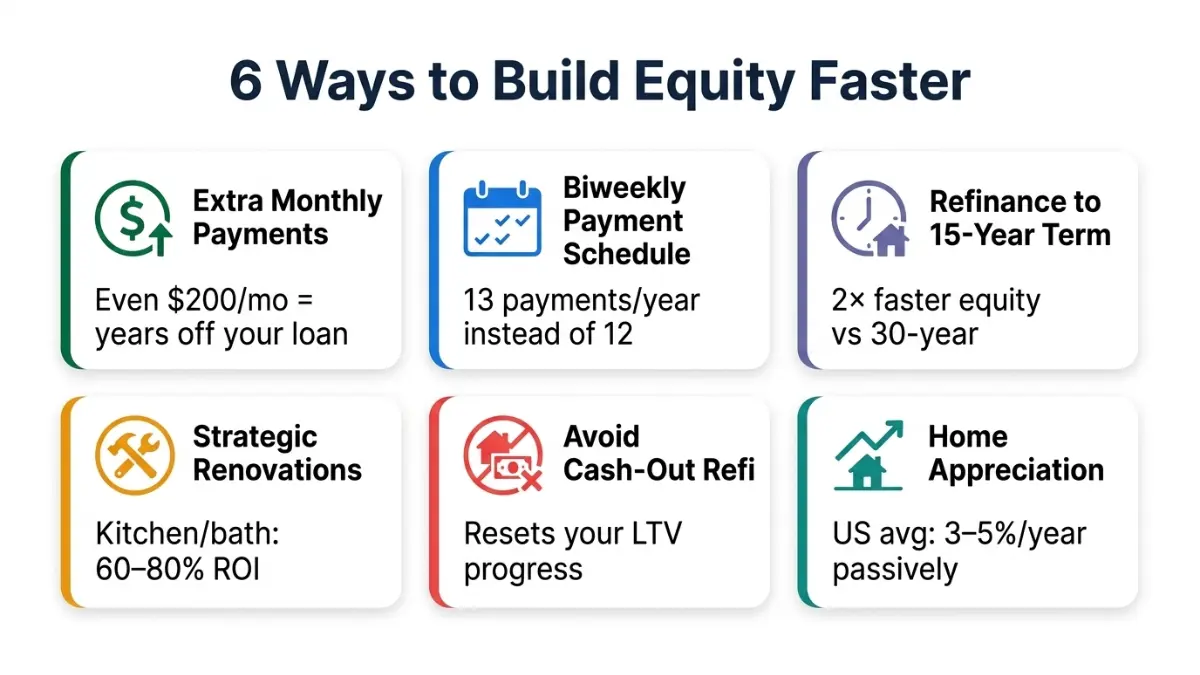
6 Proven Ways to Build Home Equity Faster in 2026
Building equity faster means more borrowing power, a lower LTV ratio, and a stronger net worth position. Here’s what actually works.
1. Make Extra Principal Payments Monthly Even $100–$200 extra per month accelerates your payoff significantly. Our calculator’s amortization mode shows you exactly how much equity you gain year by year.
2. Switch to Biweekly Payments Making half your monthly payment every two weeks results in 26 half-payments — or 13 full payments per year instead of 12. This shaves years off your mortgage with zero extra budgeting effort.
3. Refinance to a 15-Year Mortgage A 15-year mortgage builds equity nearly twice as fast as a 30-year loan. The tradeoff is a higher monthly payment, but a significantly lower total interest cost. Use our Mortgage Calculator to compare scenarios.
4. Make Strategic Home Improvements Not all renovations are equal. Kitchen and bathroom remodels, energy-efficient upgrades, and curb appeal improvements typically return 60–80% of costs in home value increases.
5. Avoid Cash-Out Refinancing Unless Necessary Every time you pull equity out, you reset your LTV clock. This should be reserved for high-ROI purposes only, not consumer spending.
6. Let Appreciation Work U.S. home values have historically appreciated 3–5% annually. On a $400,000 home, that’s $12,000–$20,000 in passive equity gains per year — without a single extra payment.
Real Example: How $200/Month Extra Changes Your Equity
Here’s what happens on a $400,000 home with a $260,000 mortgage at 6.5% APR over 10 years, modeled using the amortization projection in our calculator:
| Year | Home Value (3% appreciation) | Mortgage Balance | Equity | CLTV |
|---|---|---|---|---|
| Now | $400,000 | $260,000 | $140,000 | 65.0% |
| Year 3 | $437,090 | $244,800 | $192,290 | 56.0% |
| Year 5 | $463,710 | $234,100 | $229,610 | 50.5% |
| Year 10 | $537,570 | $193,500 | $344,070 | 36.0% |
💡 Expert Insight: “In a rate environment where one Fed cut is projected for all of 2026, homeowners who already have a low fixed mortgage rate should strongly consider a home equity loan over a cash-out refinance — you preserve your existing rate while accessing cash.” — Laura M. Bennett, CFP®, Senior Financial Advisor, FinanceAuthorityHub.com
See how your equity could grow alongside your retirement savings using our Retirement Calculator.
Smart Ways to Use Home Equity in 2026 — And 3 Risks You Must Know

Best Uses: Ranked by Financial Wisdom
| Use Case | Financial Logic | Risk Level |
|---|---|---|
| Home renovations | Directly increases property value; interest may be tax-deductible per IRS Publication 936 | Low |
| Debt consolidation | Home equity rates (7.84%) beat credit card rates (20%+) | Medium |
| Emergency fund backup | Lower rate than personal loans; better than liquidating investments | Low–Medium |
| Education costs | Lower rate than most private student loans | Medium |
| Investment property down payment | Potential high ROI but your home is on the line | High |
| Everyday spending / vacations | Avoid — you’re borrowing against your home for depreciating expenses | Very High |
⚠️ IRS Tax Note: Home equity loan interest is only tax-deductible when the funds are used to “buy, build, or substantially improve” your home, per IRS Publication 936. Interest on funds used for debt consolidation or personal expenses is not deductible for tax years after 2017.
3 Serious Risks Every Borrower Must Understand
Risk 1 — Foreclosure Your home is the collateral. If you miss payments on a home equity loan or HELOC, the lender can foreclose. This is not a personal loan — the stakes are entirely different. The HUD housing counseling program provides free guidance if you’re ever at risk.
Risk 2 — Going Underwater If home values drop 15–20% (as they did in 2008–2010), homeowners who borrowed at 85% CLTV can easily end up owing more than their home is worth. Our calculator’s sensitivity grid shows exactly how your equity evaporates at different home value scenarios.
Risk 3 — Variable Rate Risk on HELOCs HELOCs have variable rates tied to the prime rate. A 2% rate increase on a $100,000 HELOC adds $2,000/year to your interest costs. If you need payment certainty, a fixed-rate home equity loan is safer.
Do You Qualify? 2026 Requirements at a Glance
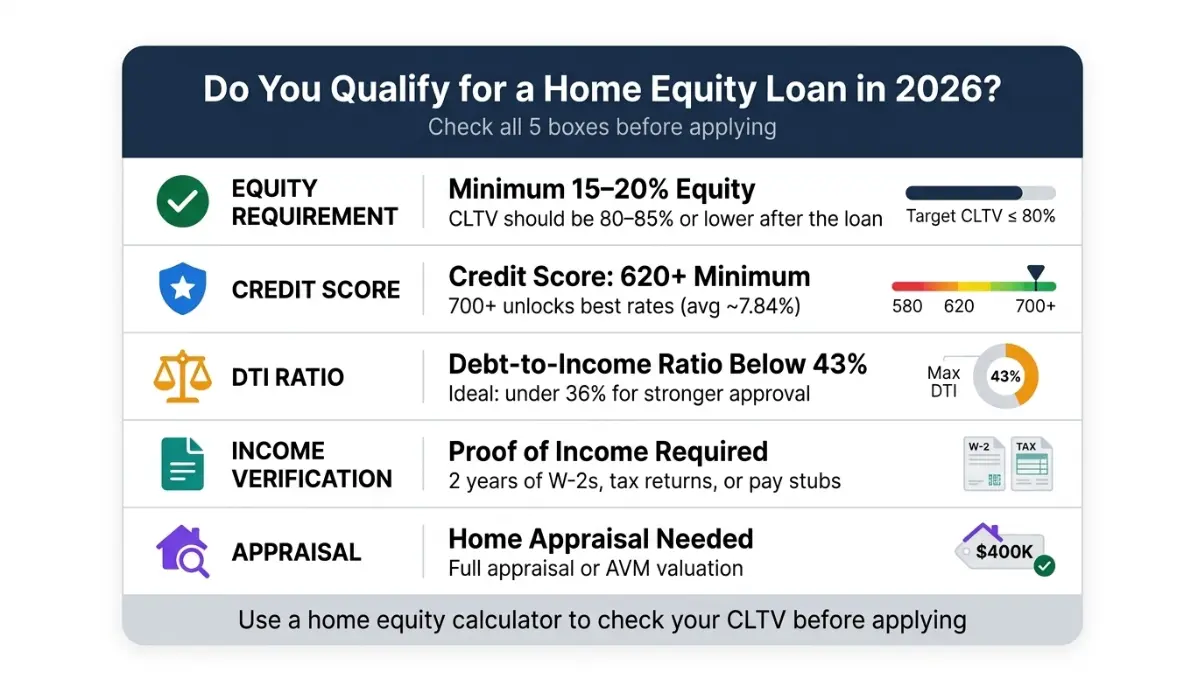
Most U.S. lenders in 2026 require:
- Minimum equity: 15–20% (CLTV at or below 80–85%)
- Credit score: 620+ minimum; 700+ for best rates
- Debt-to-income (DTI) ratio: Below 43%; ideally below 36%
- Income verification: 2 years of W-2s or tax returns
- Appraisal: Full or automated (AVM) depending on lender
Check your DTI before applying using our Debt-to-Income Ratio Calculator. You can also review the 4 strategic ways to use home equity in a rate-cut environment for additional context.
Frequently Asked Questions
1. How do I calculate my home equity?
Subtract all outstanding mortgage and lien balances from your home’s current market value. Example: $500,000 home − $320,000 mortgage = $180,000 equity (36%).
2. What is a good LTV ratio for a home equity loan?
Below 80% is ideal. At 80% CLTV or lower, you qualify for the best rates and the widest range of lenders. This is also the threshold at which PMI is typically removed from conventional loans.
3. What is the difference between LTV and CLTV?
LTV measures only your first mortgage against home value. CLTV includes all loans — first mortgage, second mortgage, and any HELOC balance. Lenders always use CLTV for home equity product approvals.
4. How much of my home equity can I borrow?
Most lenders cap borrowing at 80–85% CLTV. Subtract your current total debt from 80–85% of your home value to get your maximum borrowable amount. Our calculator does this automatically.
5. What is the minimum equity needed for a HELOC?
Most lenders require at least 15–20% equity remaining after the loan, meaning your CLTV must stay at or below 80–85% after the draw.
6. What credit score do I need for a home equity loan in 2026?
Most lenders require a minimum of 620. However, to access the best rates (averaging 7.84% nationally), a score of 700 or above is strongly recommended. Some lenders accept scores in the 580s with compensating factors.
7. How does home appreciation affect my equity?
Every 1% in home value appreciation directly increases your equity in dollar terms without any additional mortgage payments. On a $400,000 home, 3% appreciation adds $12,000 in equity annually.
8. What is net equity after selling costs?
It’s your gross equity minus estimated selling expenses — typically 5–8% of sale price covering agent commissions, title fees, and closing costs. Our calculator computes this automatically.
9. Home equity loan vs. HELOC — which is better in 2026?
For single large expenses with a known cost, a home equity loan’s fixed rate offers predictability. For flexible or ongoing needs, a HELOC’s revolving credit structure may suit better — though variable rates add uncertainty in the current environment.
10. Can I remove PMI once I reach 80% LTV?
Yes. Under the Homeowners Protection Act, you can request PMI cancellation when your first-mortgage LTV reaches 80%. Use our calculator’s projection table to identify exactly when you’ll hit that threshold.
11. Is now a good time to take out a home equity loan in 2026?
Rates have trended down since mid-2025 and are at three-year lows. With only one Fed rate cut projected for 2026, rates may improve slightly but won’t drop dramatically. For homeowners with 20%+ equity who don’t want to refinance their existing mortgage, this is a reasonable window to act.
📋 Disclaimer: This article and calculator are provided for educational and informational purposes only. They do not constitute financial, legal, or tax advice. Results are estimates based on the inputs you provide and may not reflect actual lender terms, appraisal values, or market conditions. Interest deductibility depends on how funds are used — consult a licensed CPA or tax advisor regarding your specific situation. Always consult a qualified financial advisor or mortgage professional before making borrowing decisions. Your home is collateral for any home equity product — missing payments can result in foreclosure.
Informational disclaimer
The content on Finance Authority Hub is provided for general informational and educational purposes only and should not be considered personalized financial, investment, tax, legal, or professional advice. Financial decisions depend on your individual goals, income, risk tolerance, location, and regulatory situation. Before acting on any information, strategy, estimate, or calculator result, consult a qualified licensed professional who can evaluate your specific circumstances.